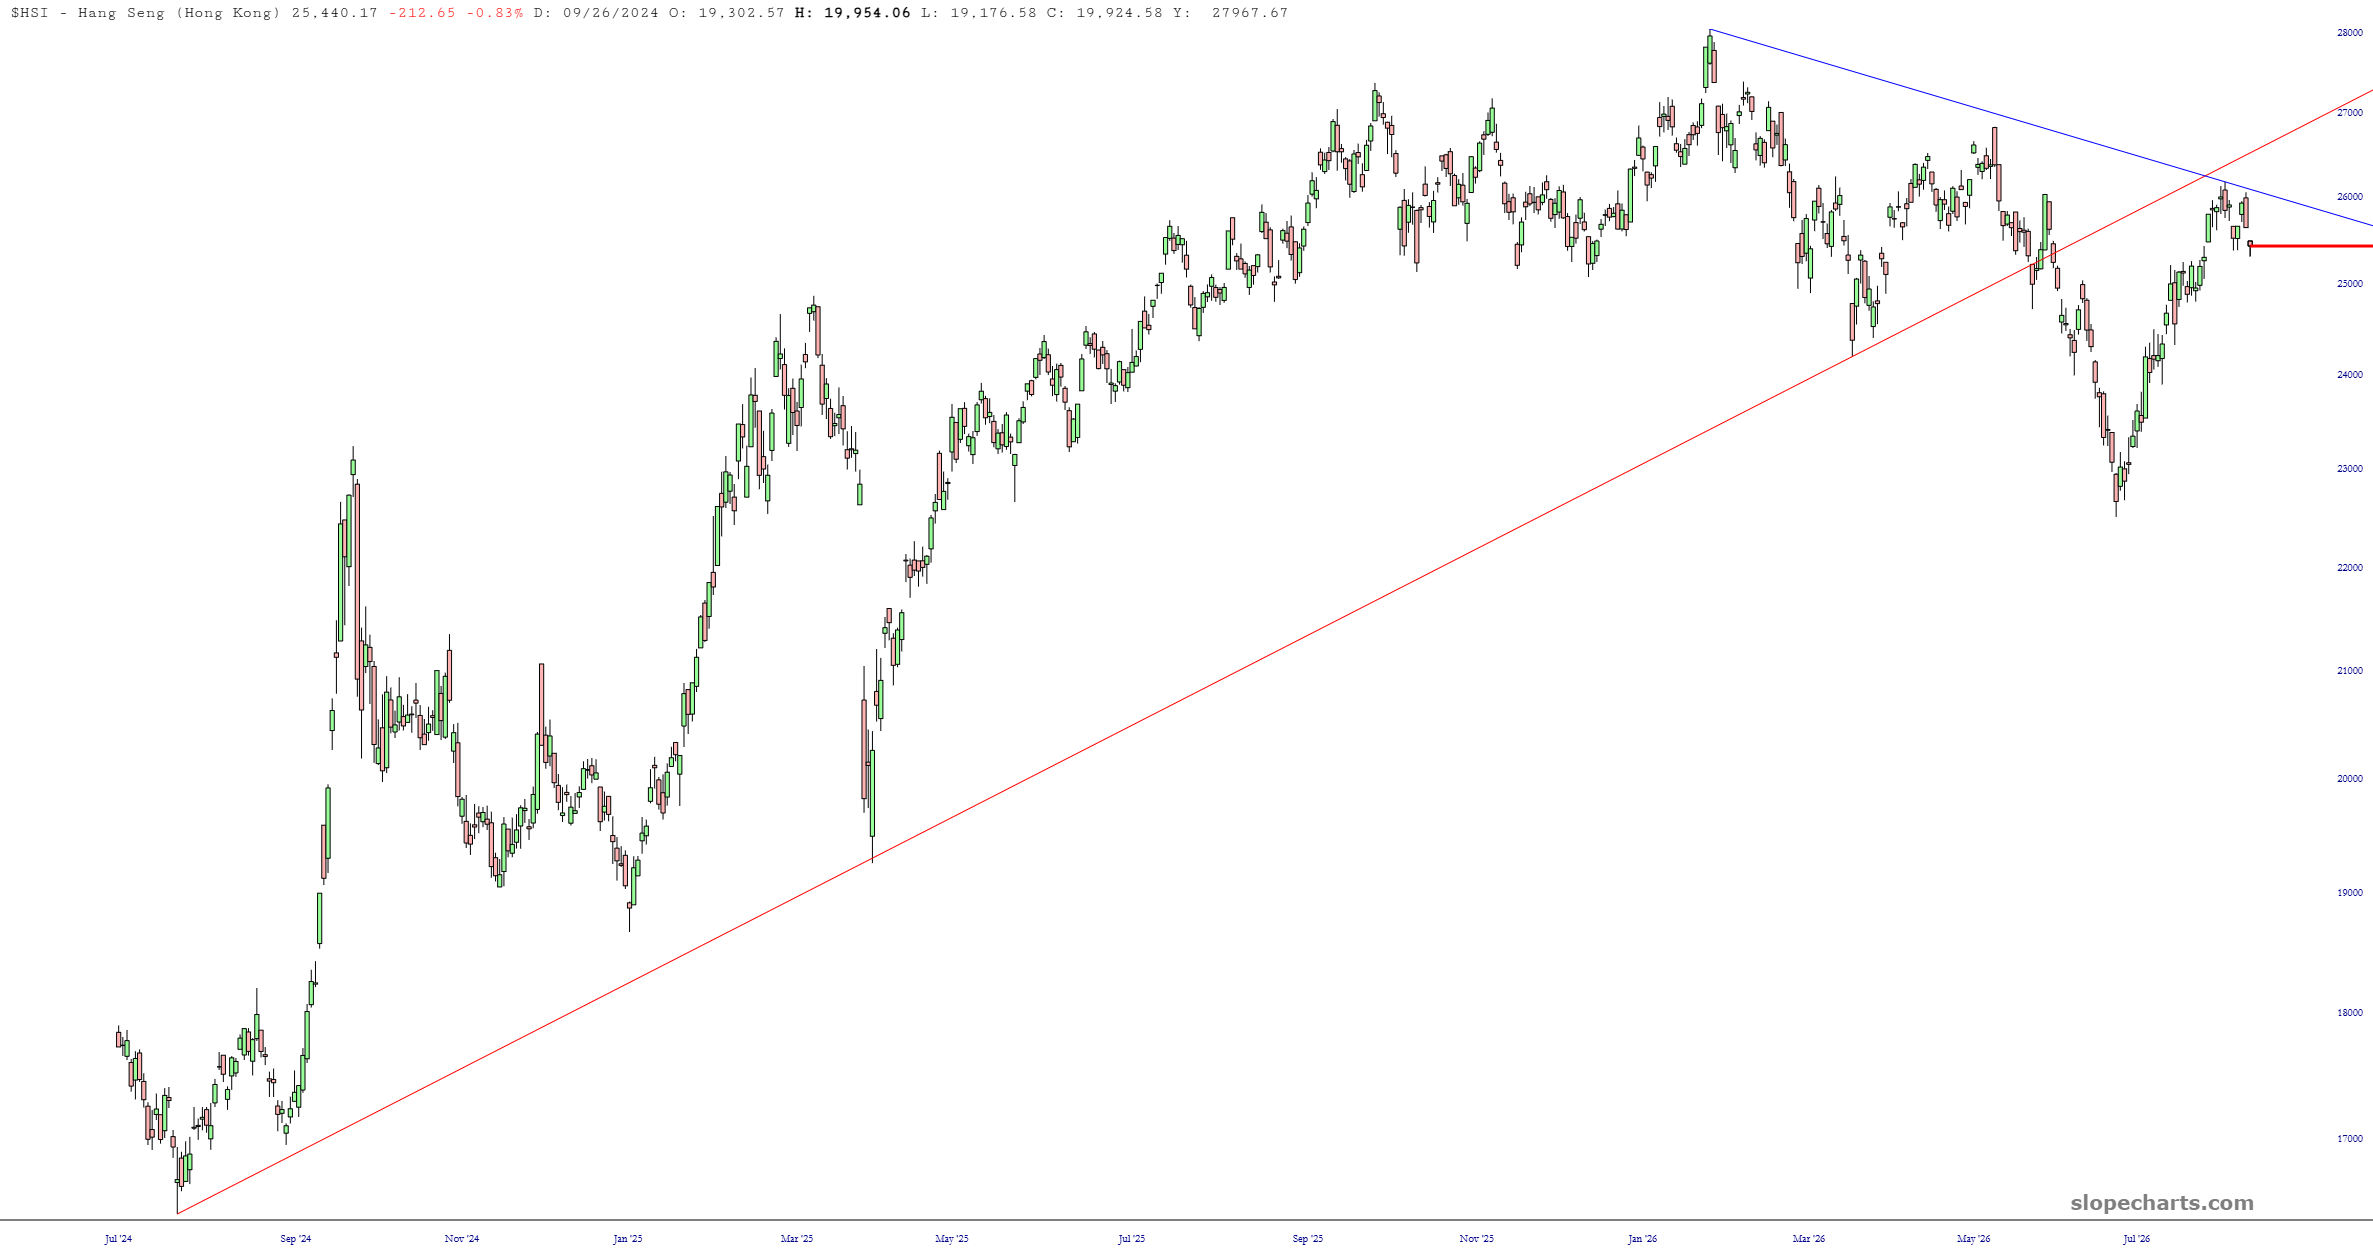

As most of you know, my largest options position is the China ETF symbol FXI. I have quite deliberately chosen March 2027 $37 puts to give me gobs of time to be right (there are presently 219 days left on these, and let’s face it, in the world we live in today, that’s about two centuries from today).
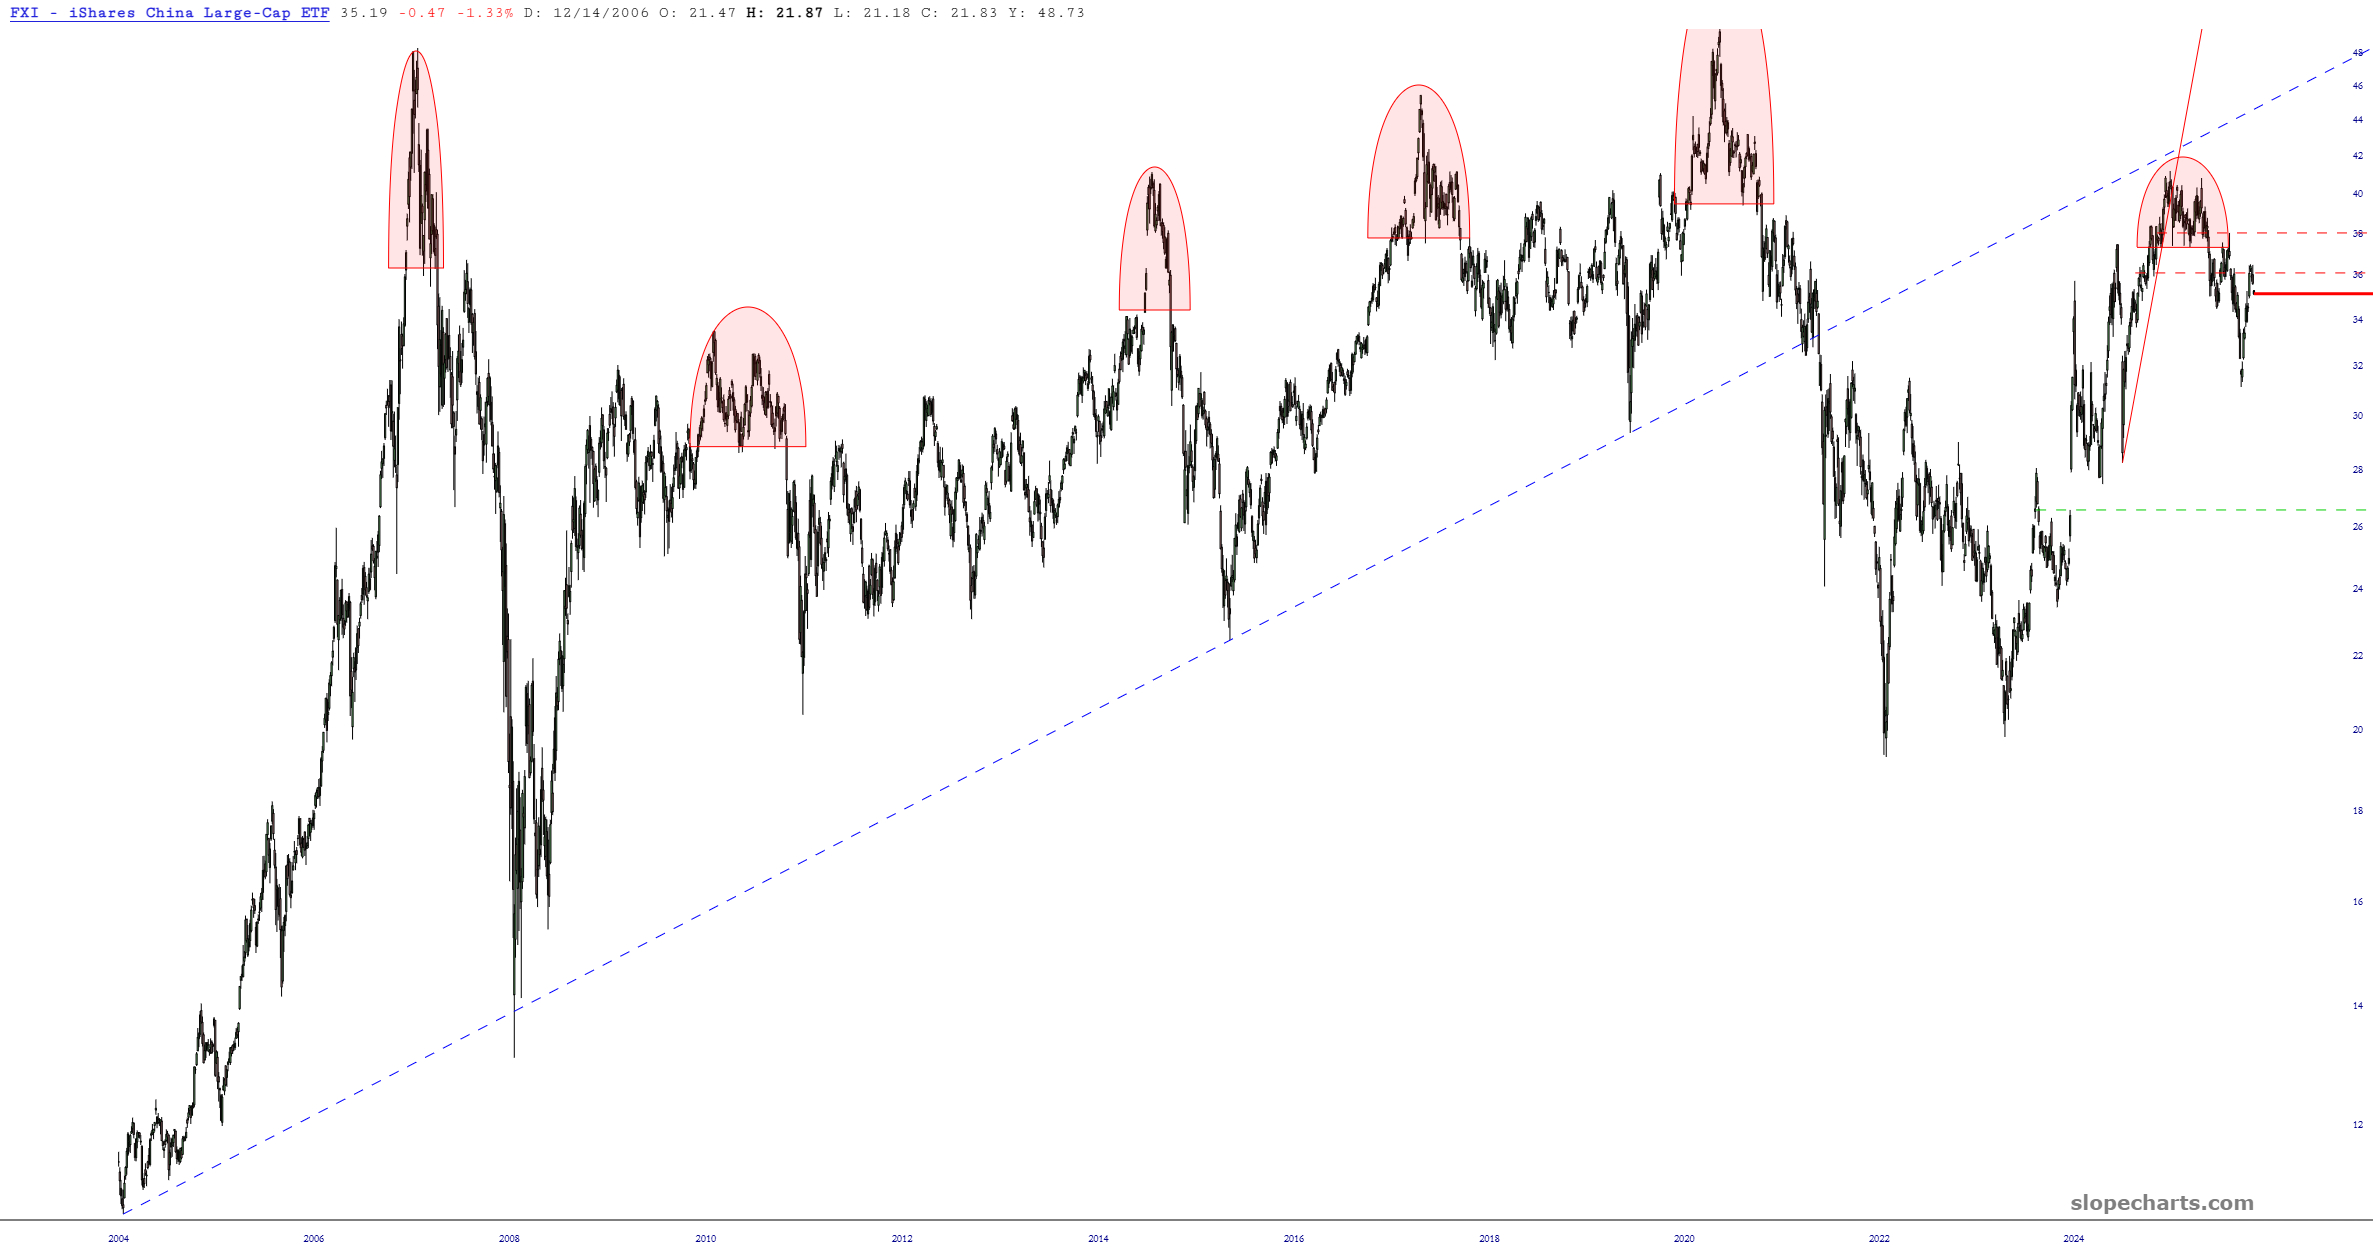
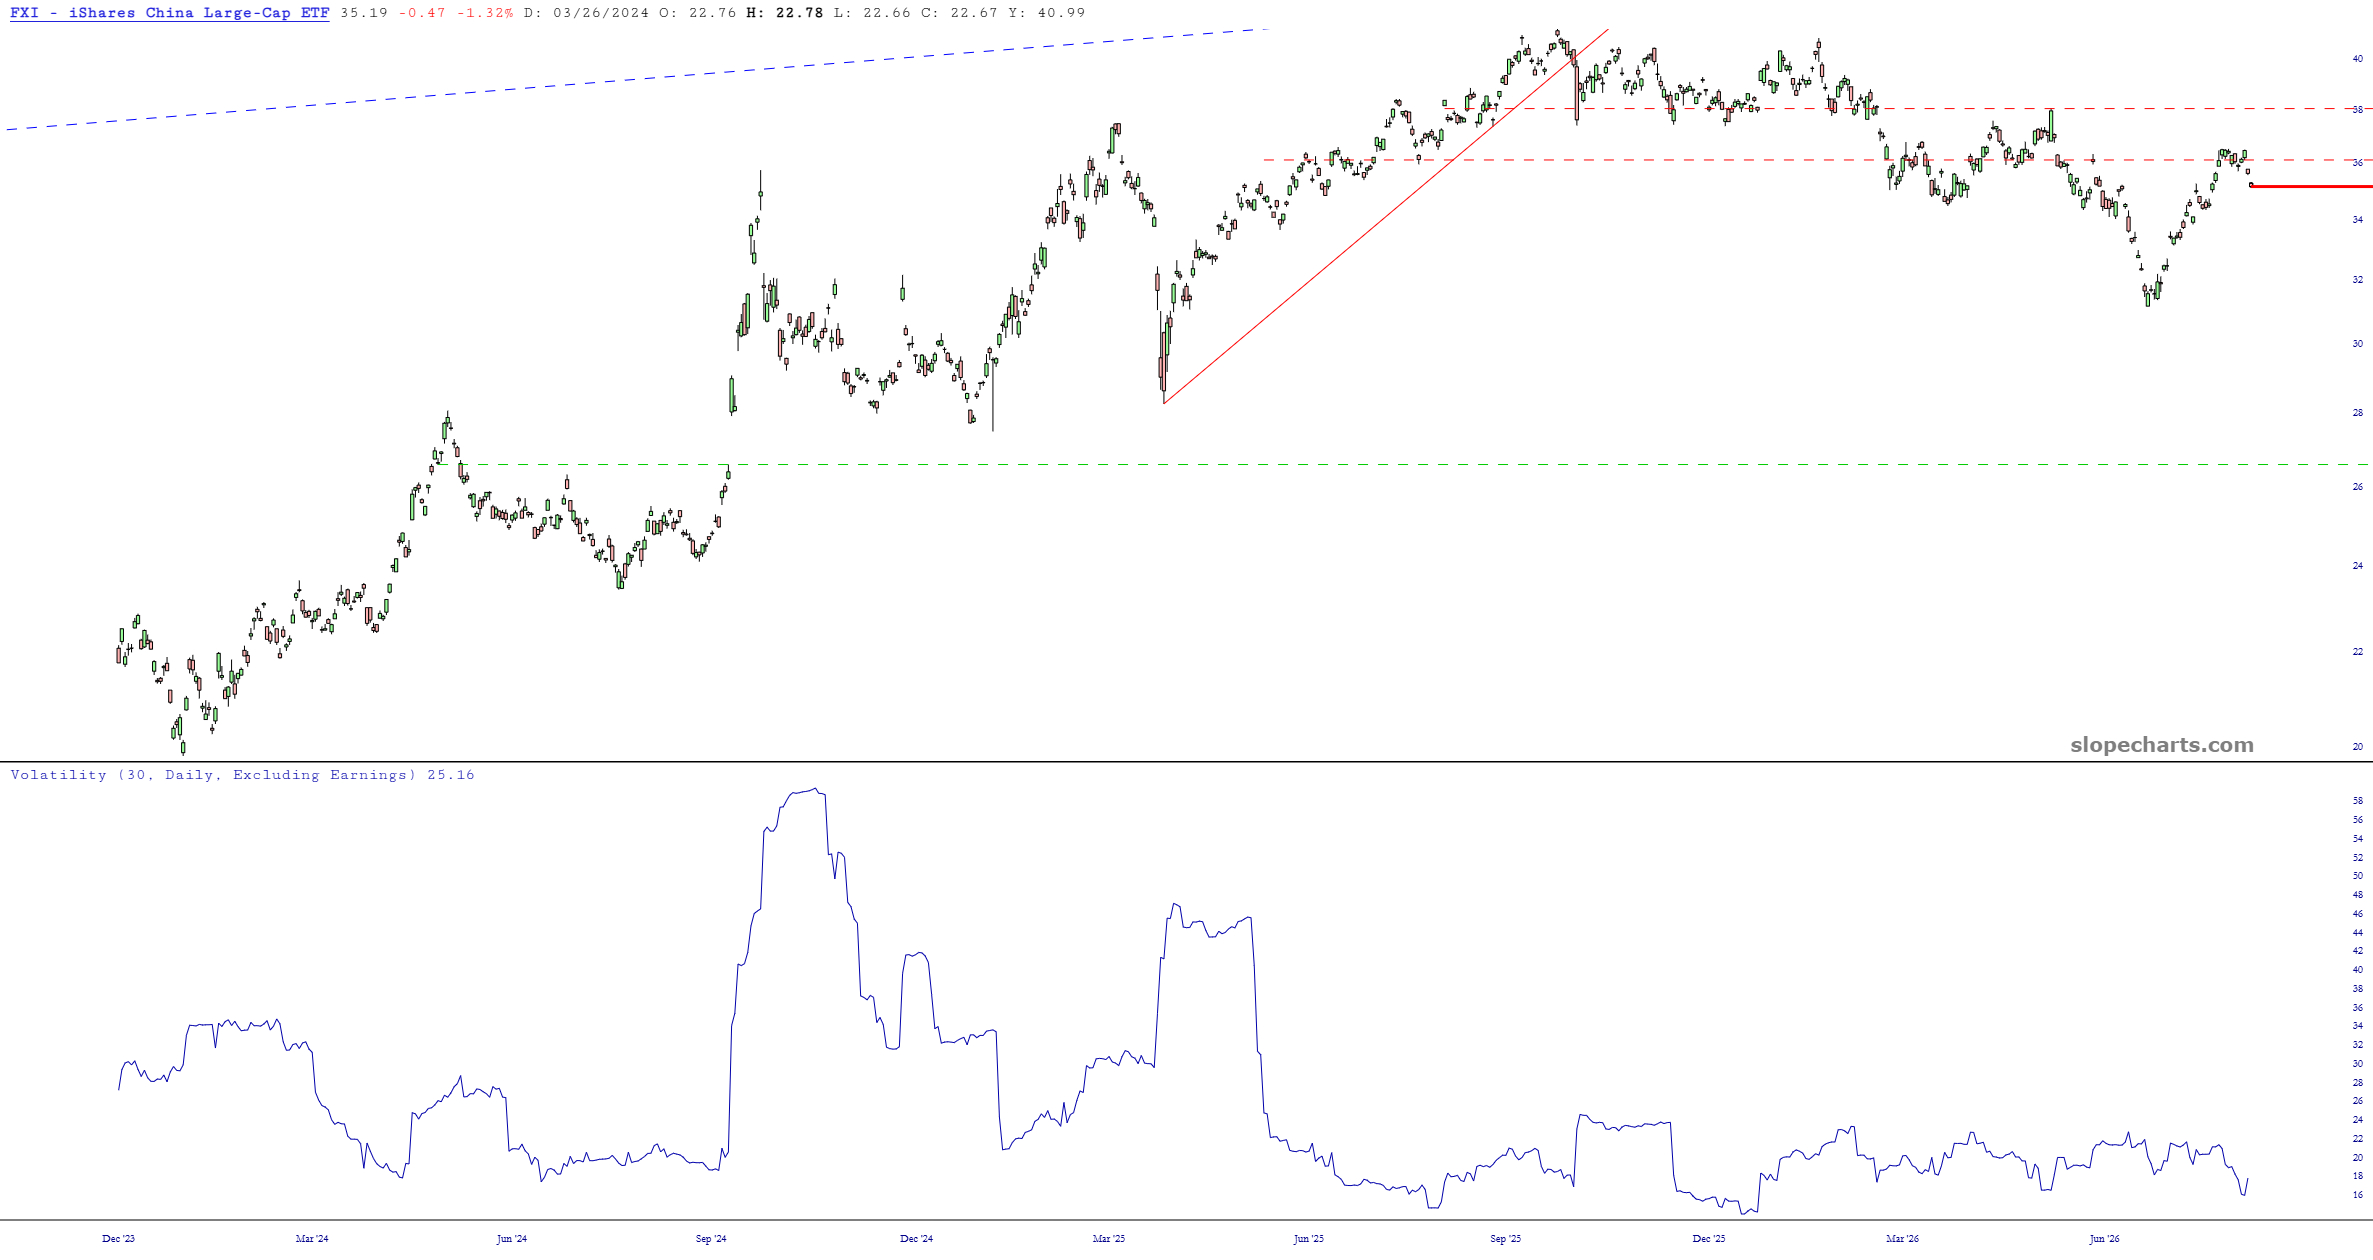
The FXI is a plodding price mover, but in my estimation, we have hammered out the sixth top in this long-term chart and are heading lower. All five preceding tops produced excellent results. It also helps that a certain someone on Pennsylvania Avenue doesn’t have a vested interest in propping this market up.
The options on FXI are cheap, but they also stink. The bid/ask spread is big enough to drive a Trailways bus through, but what are ya gonna do?
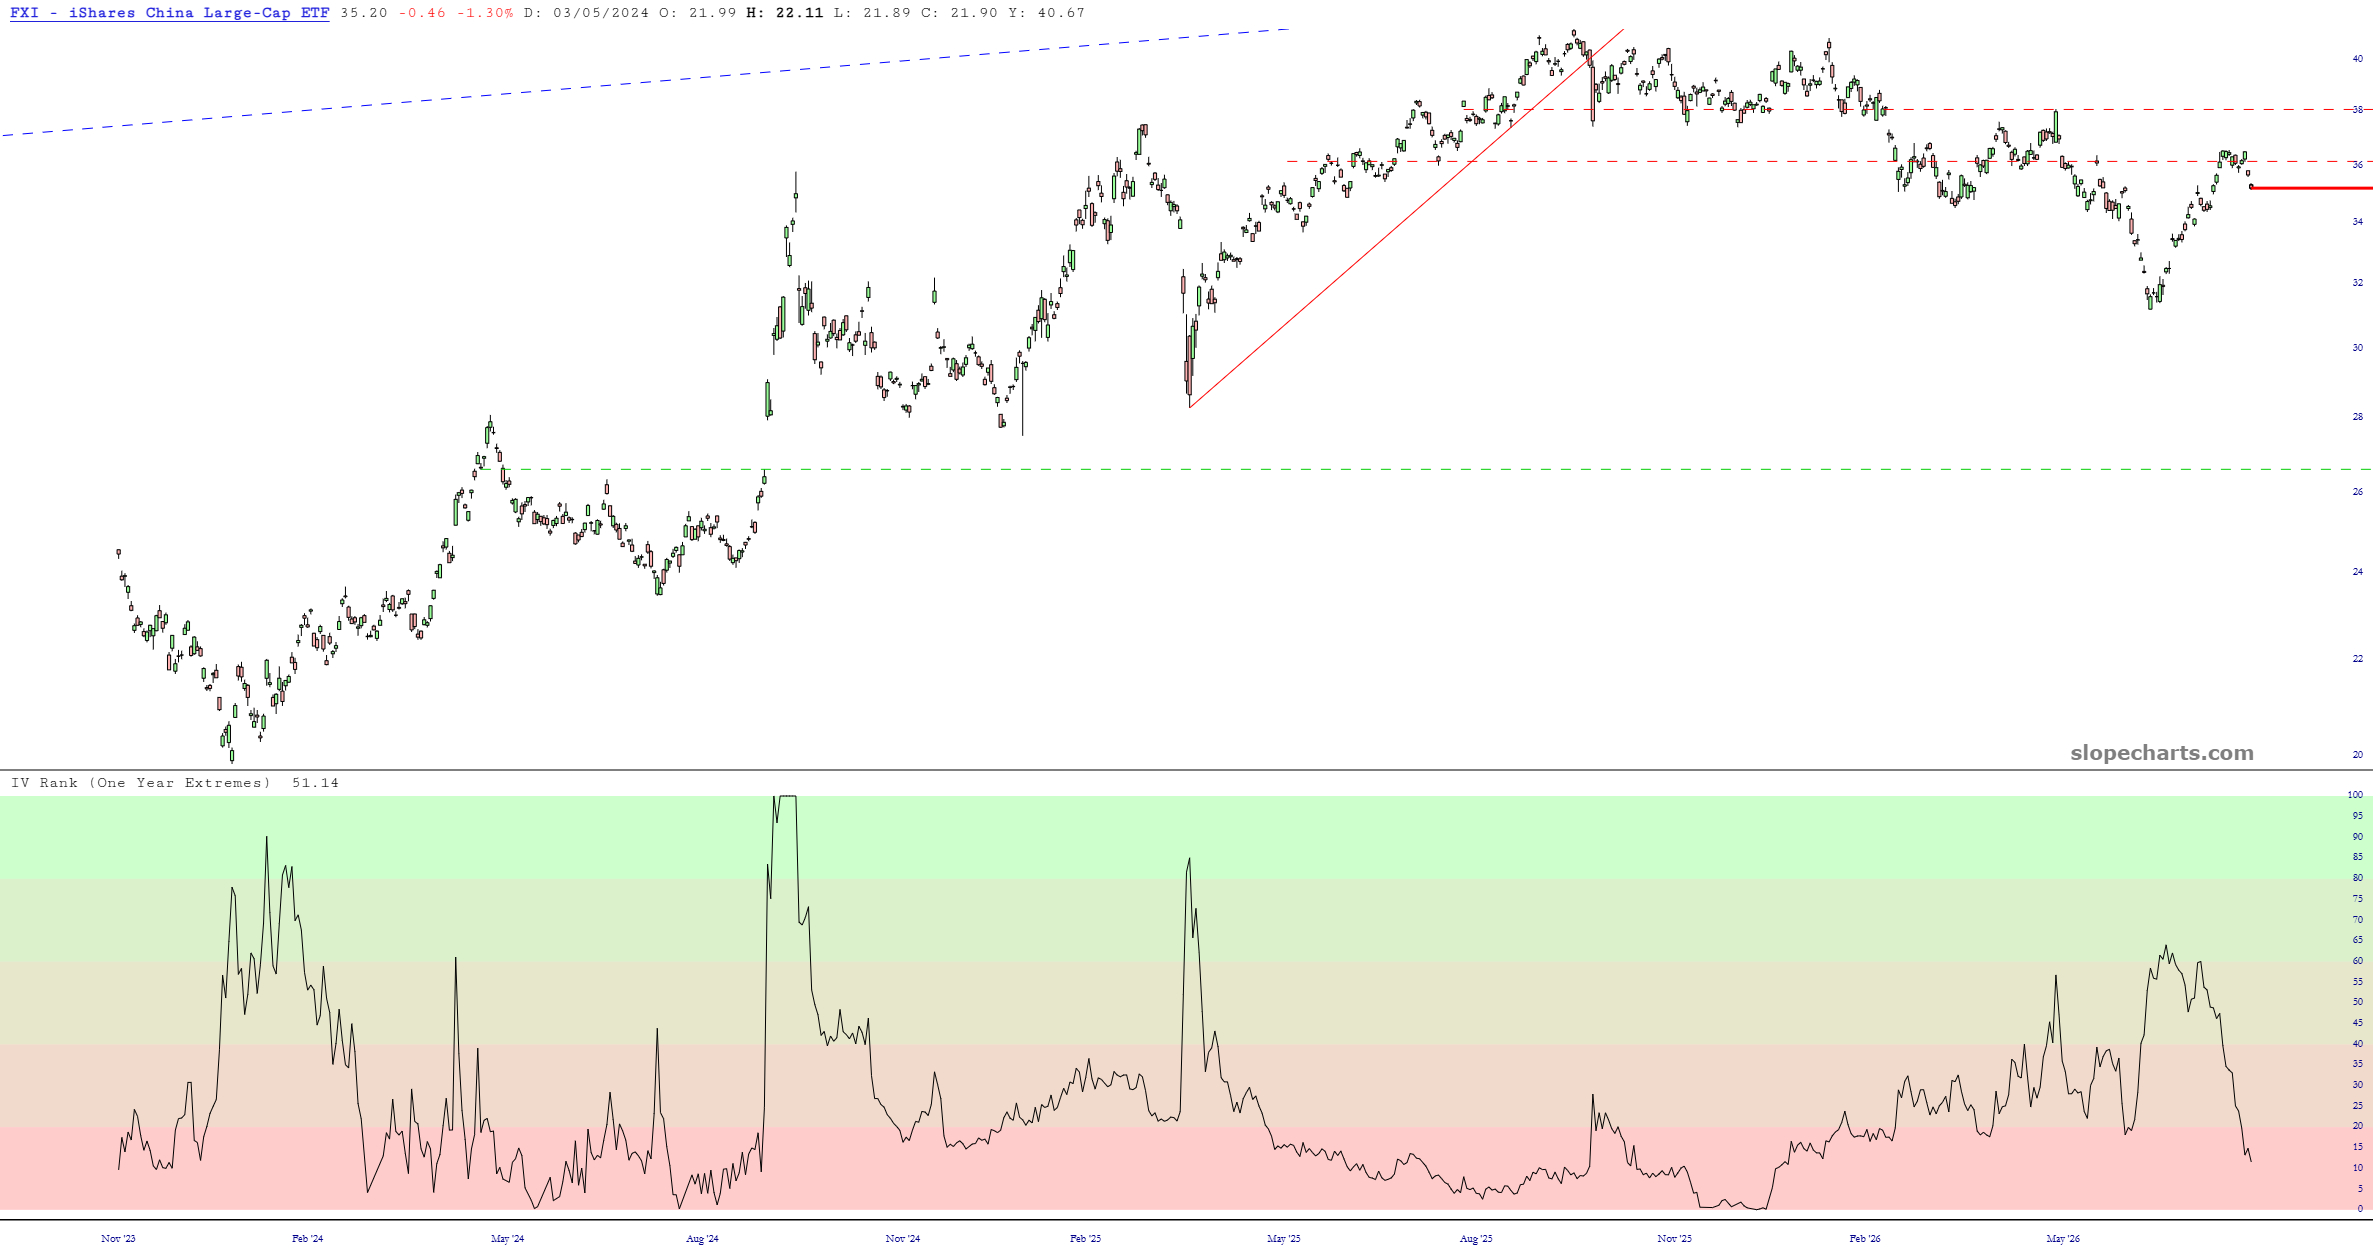
The IV Rank based on annual extremes is in the toilet.
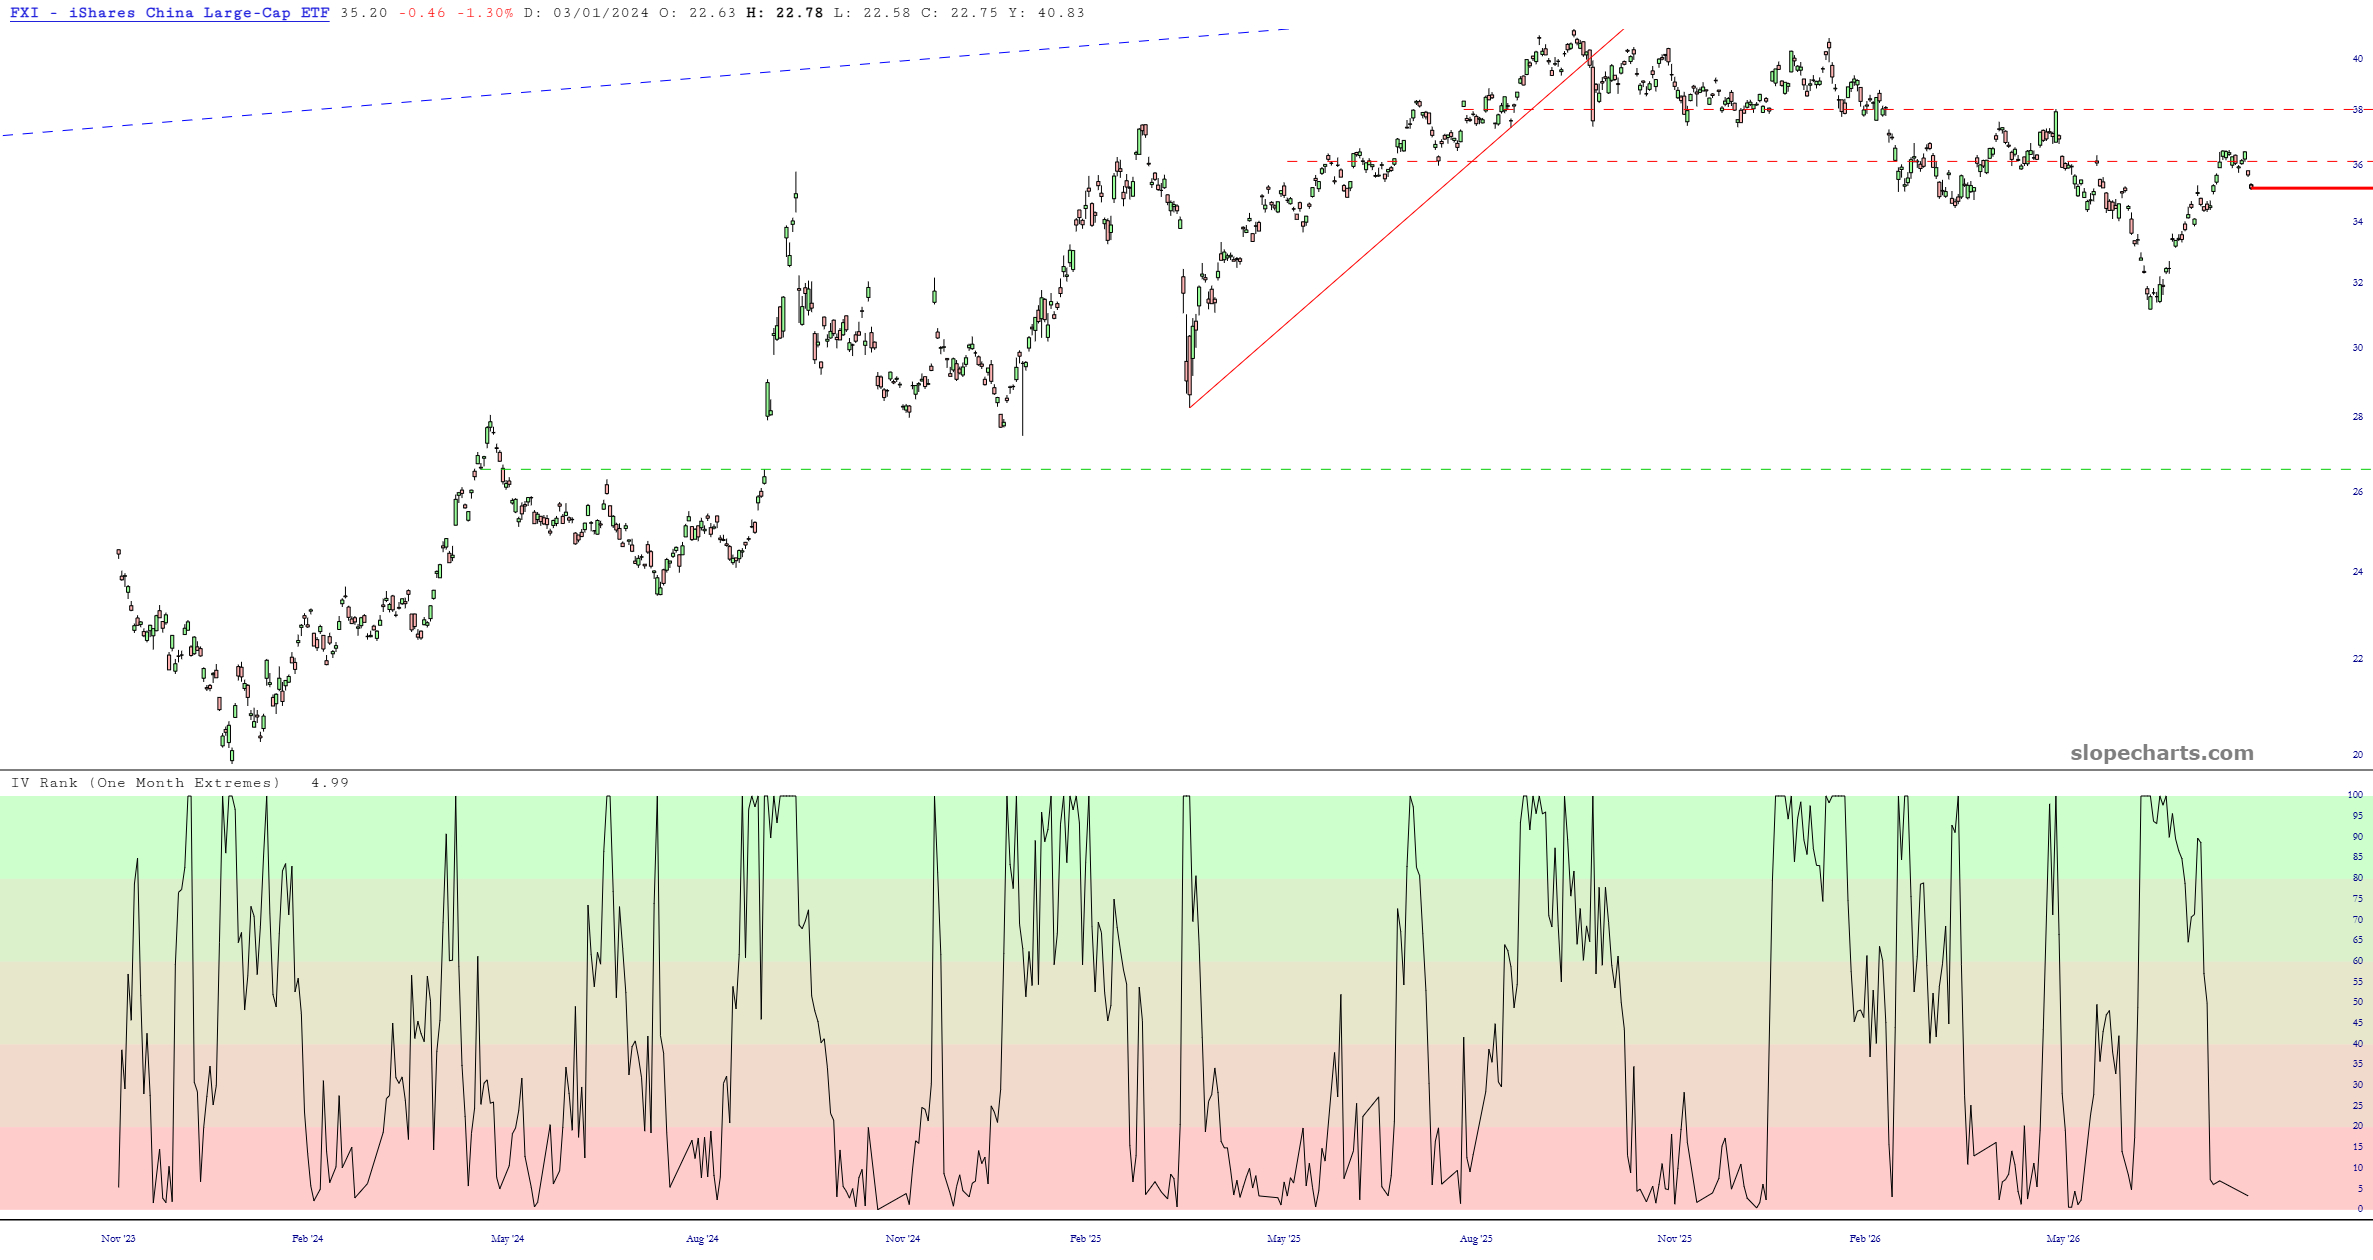
So, too, is the IV Rank based on monthly extremes.
And the plain old implied volatility value has been beaten down to nothing.
Suffice it to say that the market perceives FXI to be an oil painting, whereas I think it’s going to get hammered hard. It’s already down almost 5% since Monday, and my own target for this, shall we say, much lower.
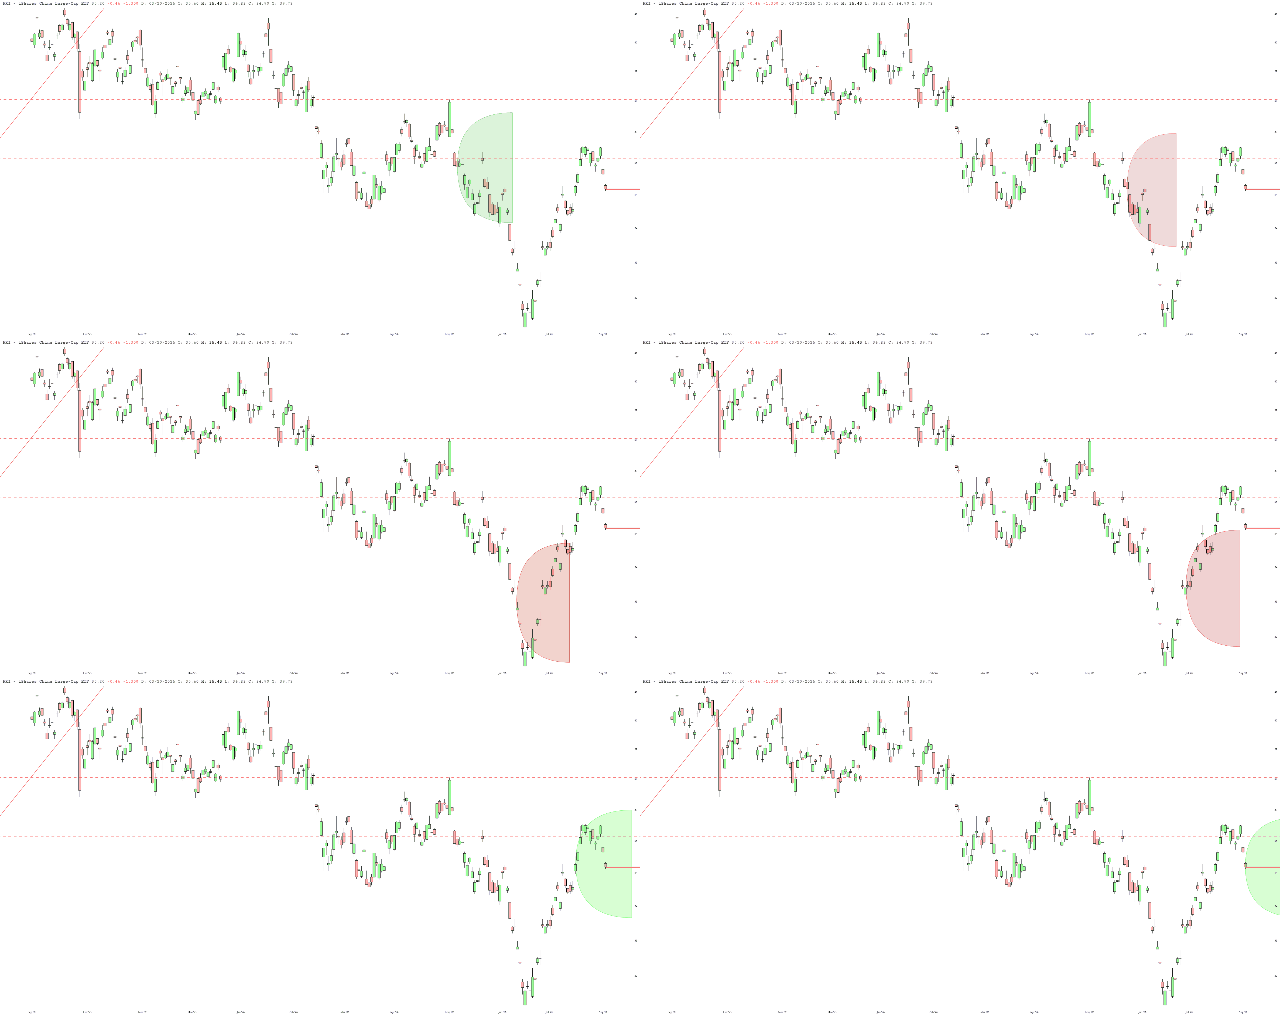
Oh, and here’s a SlopeCharts feature I bet you forgot about: the animated price cone! You can see how it has gone green (that is, extrinsic value has gone way down) and its expected range is quite modest.
In sum, I’d say the Chinese stock market is going to be substantially lower by mid-March than it is now.