The mighty weight of Slope’s bear power has been fully focused in oil as of late, as our beloved and hard working leader called a top on the black gold with accuracy that Dennis Gartman would pay for in U.S. dollar terms. (editor’s note: I’m touched!)
But is it time to pause or reverse? A bit of price and time analysis on the daily chart reveals a potential zone of trouble for bears.
First, let’s look at price.
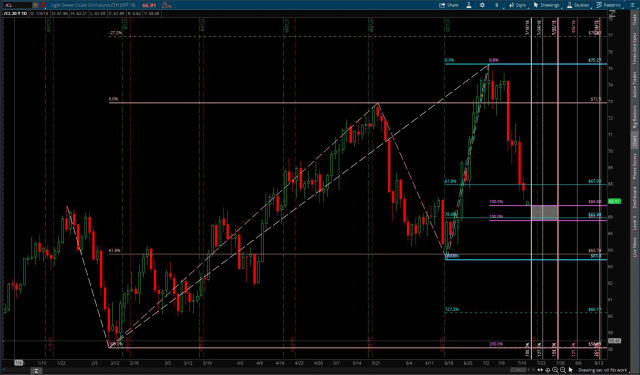
When the front month contract switched to September on Tuesday evening, price gapped lower on the continuous chart to the top of the zone predicted by prior swing retracements in price amount during this bull market.
That zone is 66.68-65.77.
The top of that zone is created by the retracement from the January 25, 2018 to the February 9th low.
The bottom of that zone comes from our more recent swing retracement: The May 22, 2018 high to the June 18th low.
Now to time.
Timing for these lows as defined as the length of days it took those same retracements to happen gives us a zone between July 19th-July 30th.
In general when using time projections, noted fibonacci analyst Carolyn Broden (aka Fib Queen) gives time zones a plus or minus one day, so we can say the time zone ranges from July 18th-July 31st.
We also see a 1.272 and 1.618 fibonacci time projection within that zone from the Winter retracement.
Now let’s throw in some price structure.
That price and time zone box (shaded in the picture) just happens to be in a support area where we have a 78.6% of the prior bull swing to new highs for the year, and is above a small consolidation area from which we saw a high momentum bullish candle on June 22nd.
Of note for non-fibonacci folks, the 78.6% level is often considered the level of last resort for trends, and a breach of it often leads to trend rotation or reversing.
From my own research, seasonality does not lend support to the bullish scenario. The August to September options expiration periods have been bearish in six out of the past ten years, including three bear periods in the past five years.


