Slope of Hope Blog Posts
Slope initially began as a blog, so this is where most of the website’s content resides. Here we have tens of thousands of posts dating back over a decade. These are listed in reverse chronological order. Click on any category icon below to see posts tagged with that particular subject, or click on a word in the category cloud on the right side of the screen for more specific choices.
Crypto-Chart
Although I’ve never owned a penny of any cryptocurrency, I find their charts fascinating. They are much better-behaved than equities these days………….maybe because they are actually – gasp – permitted to go up and down based on natural economic laws instead of trillions of dollars of distortion.
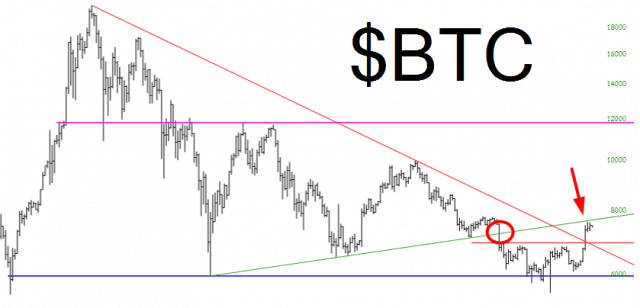
Anyway, Bitcoin is the king of them all, and its chart is particularly intriguing. It broken its symmetric triangle (red circle below) and ground down to under $6000, having peaked at almost $20,000 last December. However, it rallied mightily up to, yep, just underneath that broken trendline. Here we see a textbook example of support magically changing roles to resistance.
Microsoft Non-Event
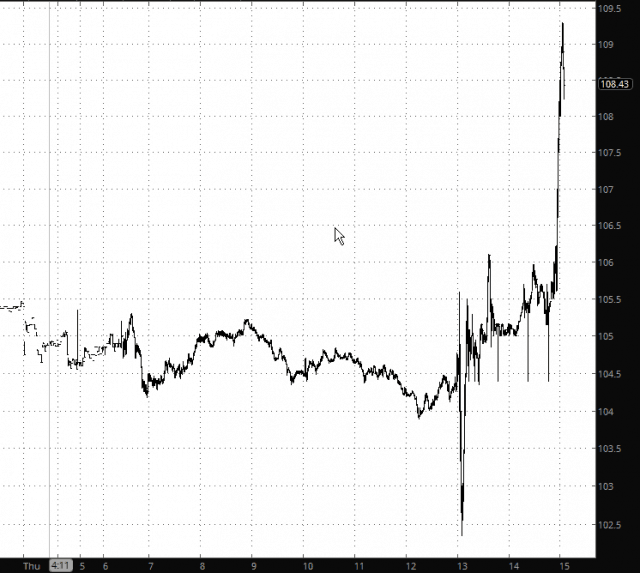
UPDATE – – the “non-event” has become an “event” (such are the dangers of creating a post during after-hours mayhem). Here’s the much more impressive result than the one shown beneath……….
Retail Strength
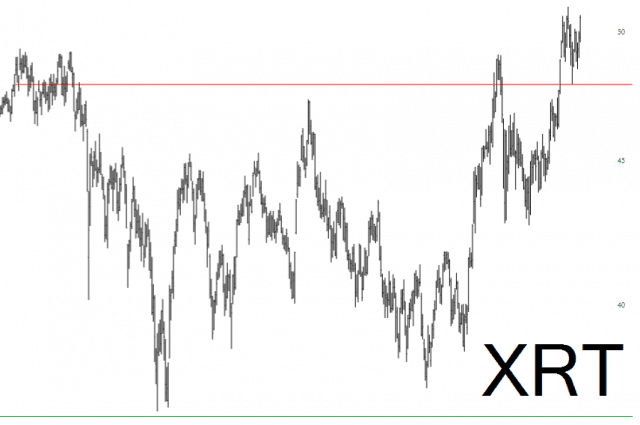
I guess there really is no meaningful limit to how much crap people will buy to try to fill that inner void. Just incredible:
Forming A Likely (Short Term) High
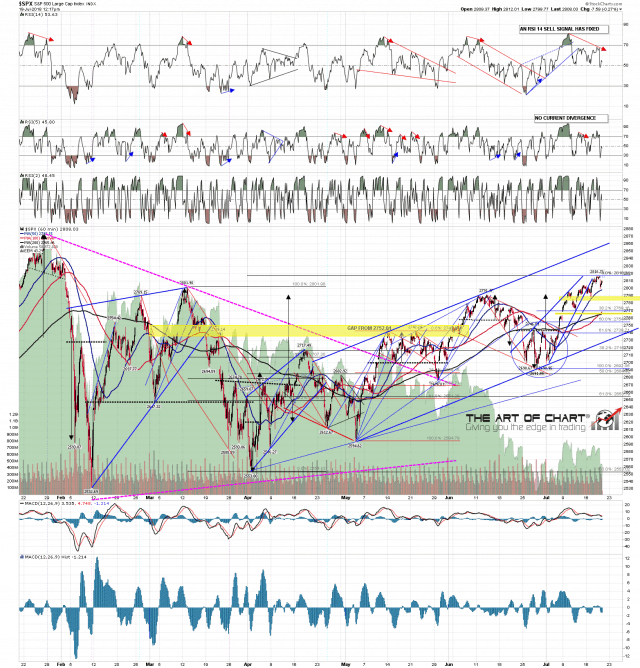
I was talking about on Tuesday about the likely short term high forming here and that process is now further advanced and possibly finished, though I think that the odds favor another short term high retest before the retracement that should follow.
Just to recap, we are expecting a short term retracement retracement to follow, lasting perhaps a week and taking SPX back into the 2750-70 range before another leg up starts that might carry SPX up to the all time high retest.
In the short term an hourly RSI 14 sell signal has now fixed and a daily RSI 5 sell signal is brewing. Key short term trend support is at the 50 hour MA, currently in the 2798 area, and if we see a high retest from here I’d expect that to be the second high of a small double top. SPX 60min chart:


