Stan was suggesting in his post market video last night that today might be pretty quiet, and so it was. Lovely two way day for intraday trades and I had a very enjoyable trading day myself calling the move up and then the fail in the final hours, but nothing much happened from a swing trader perspective apart from compression for the next move, in a direction still to be determined.
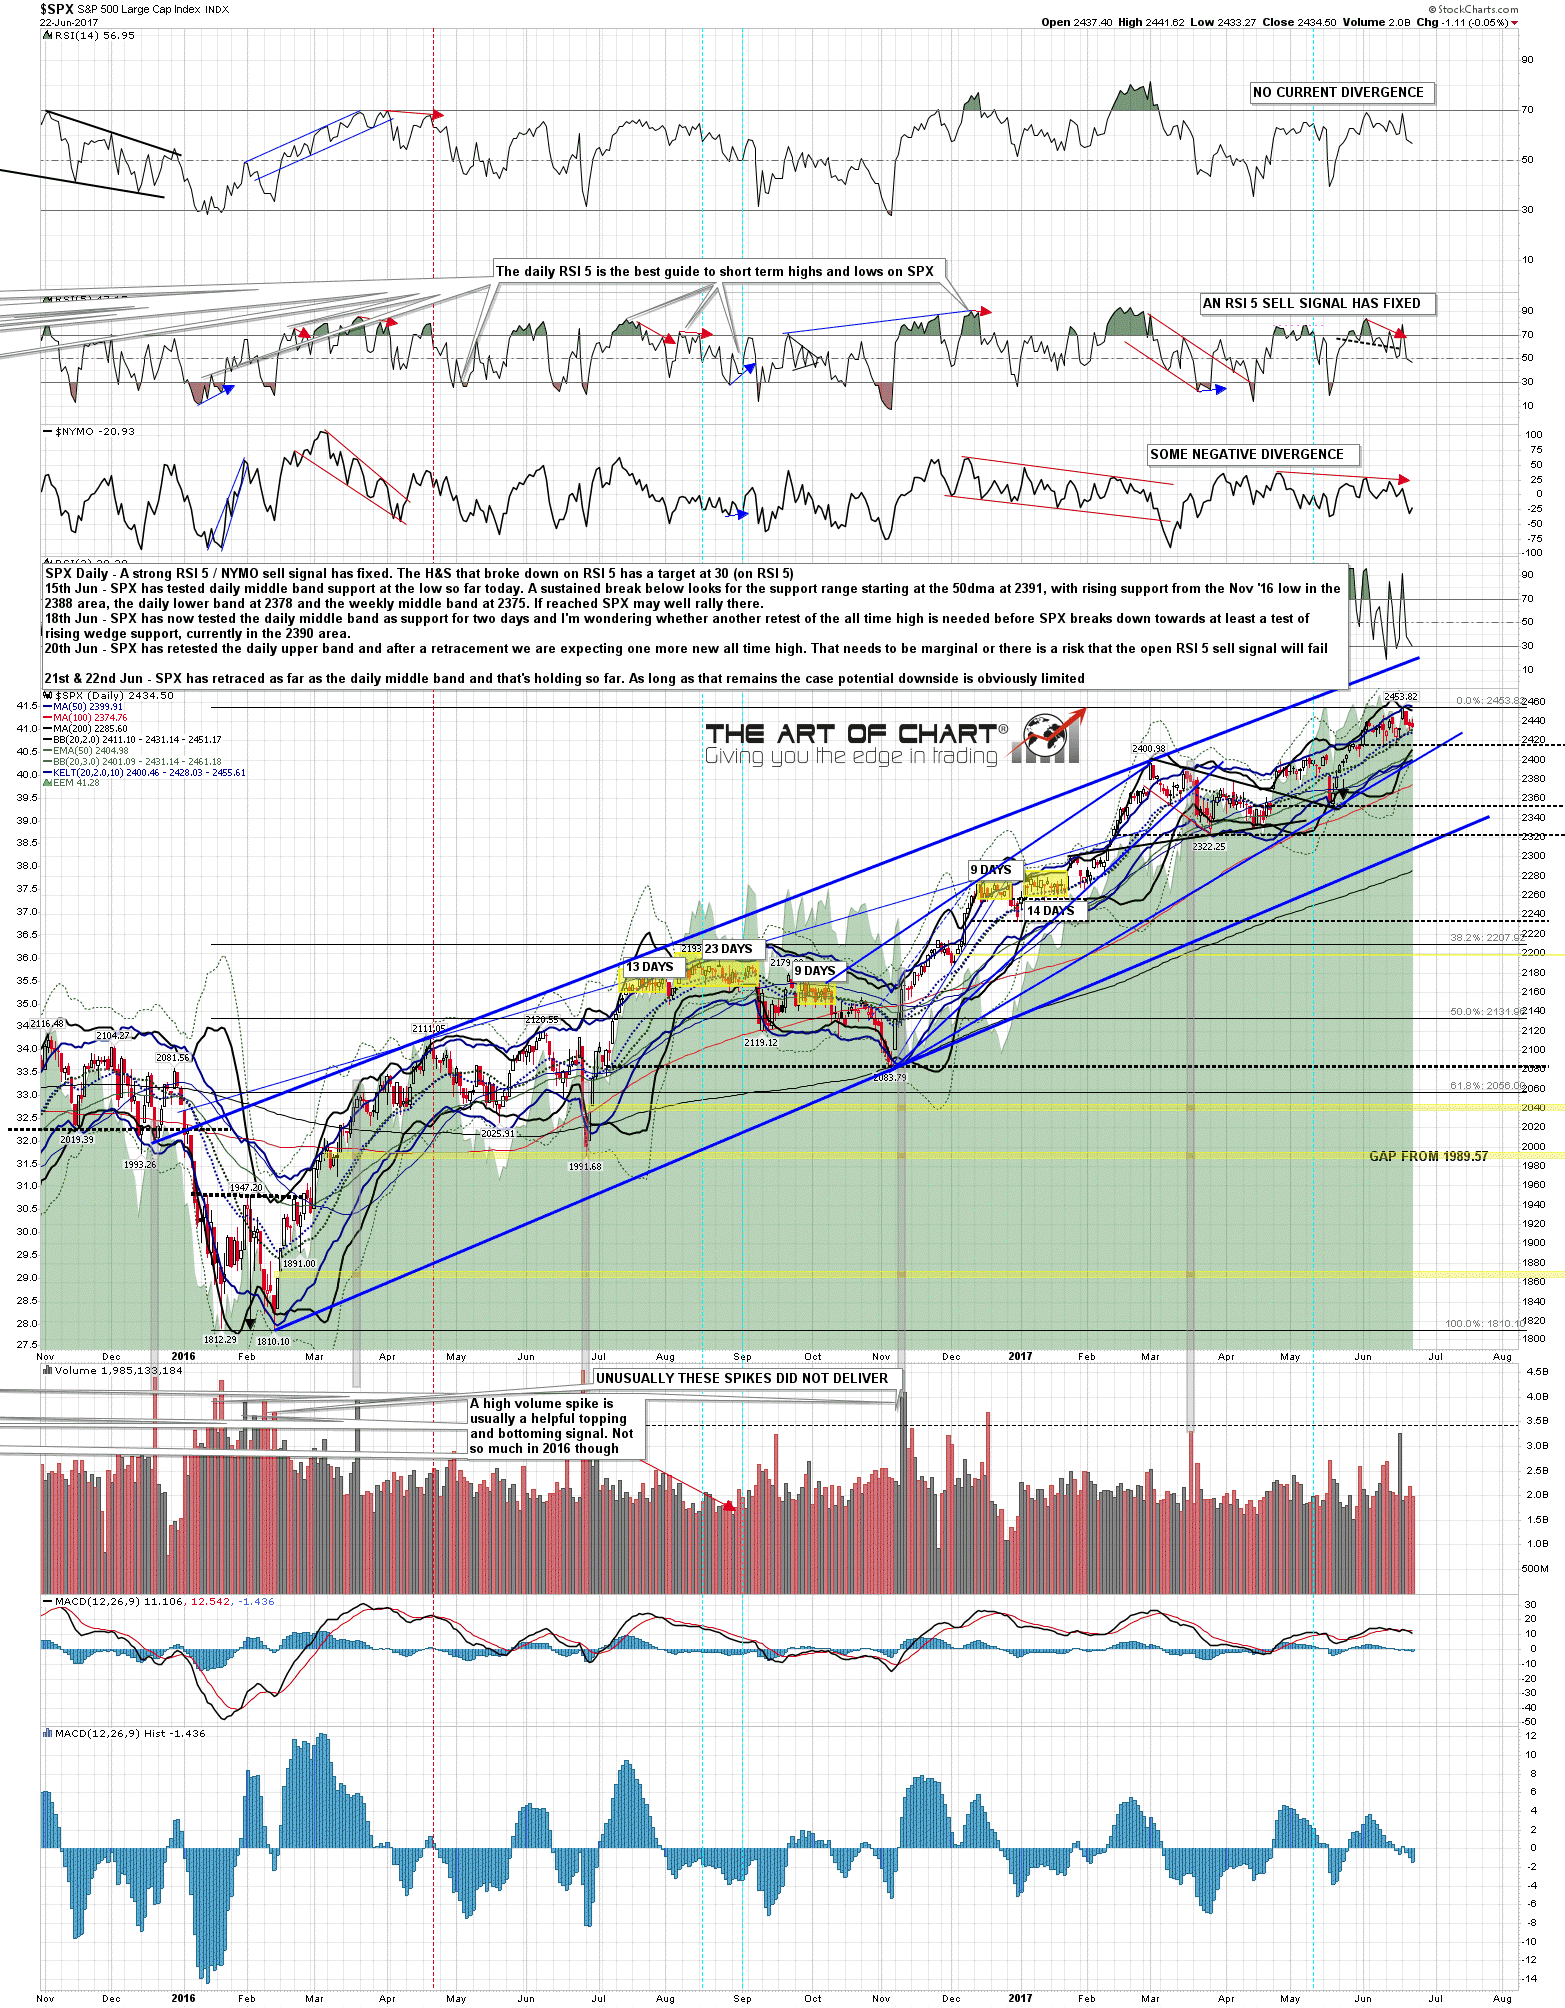
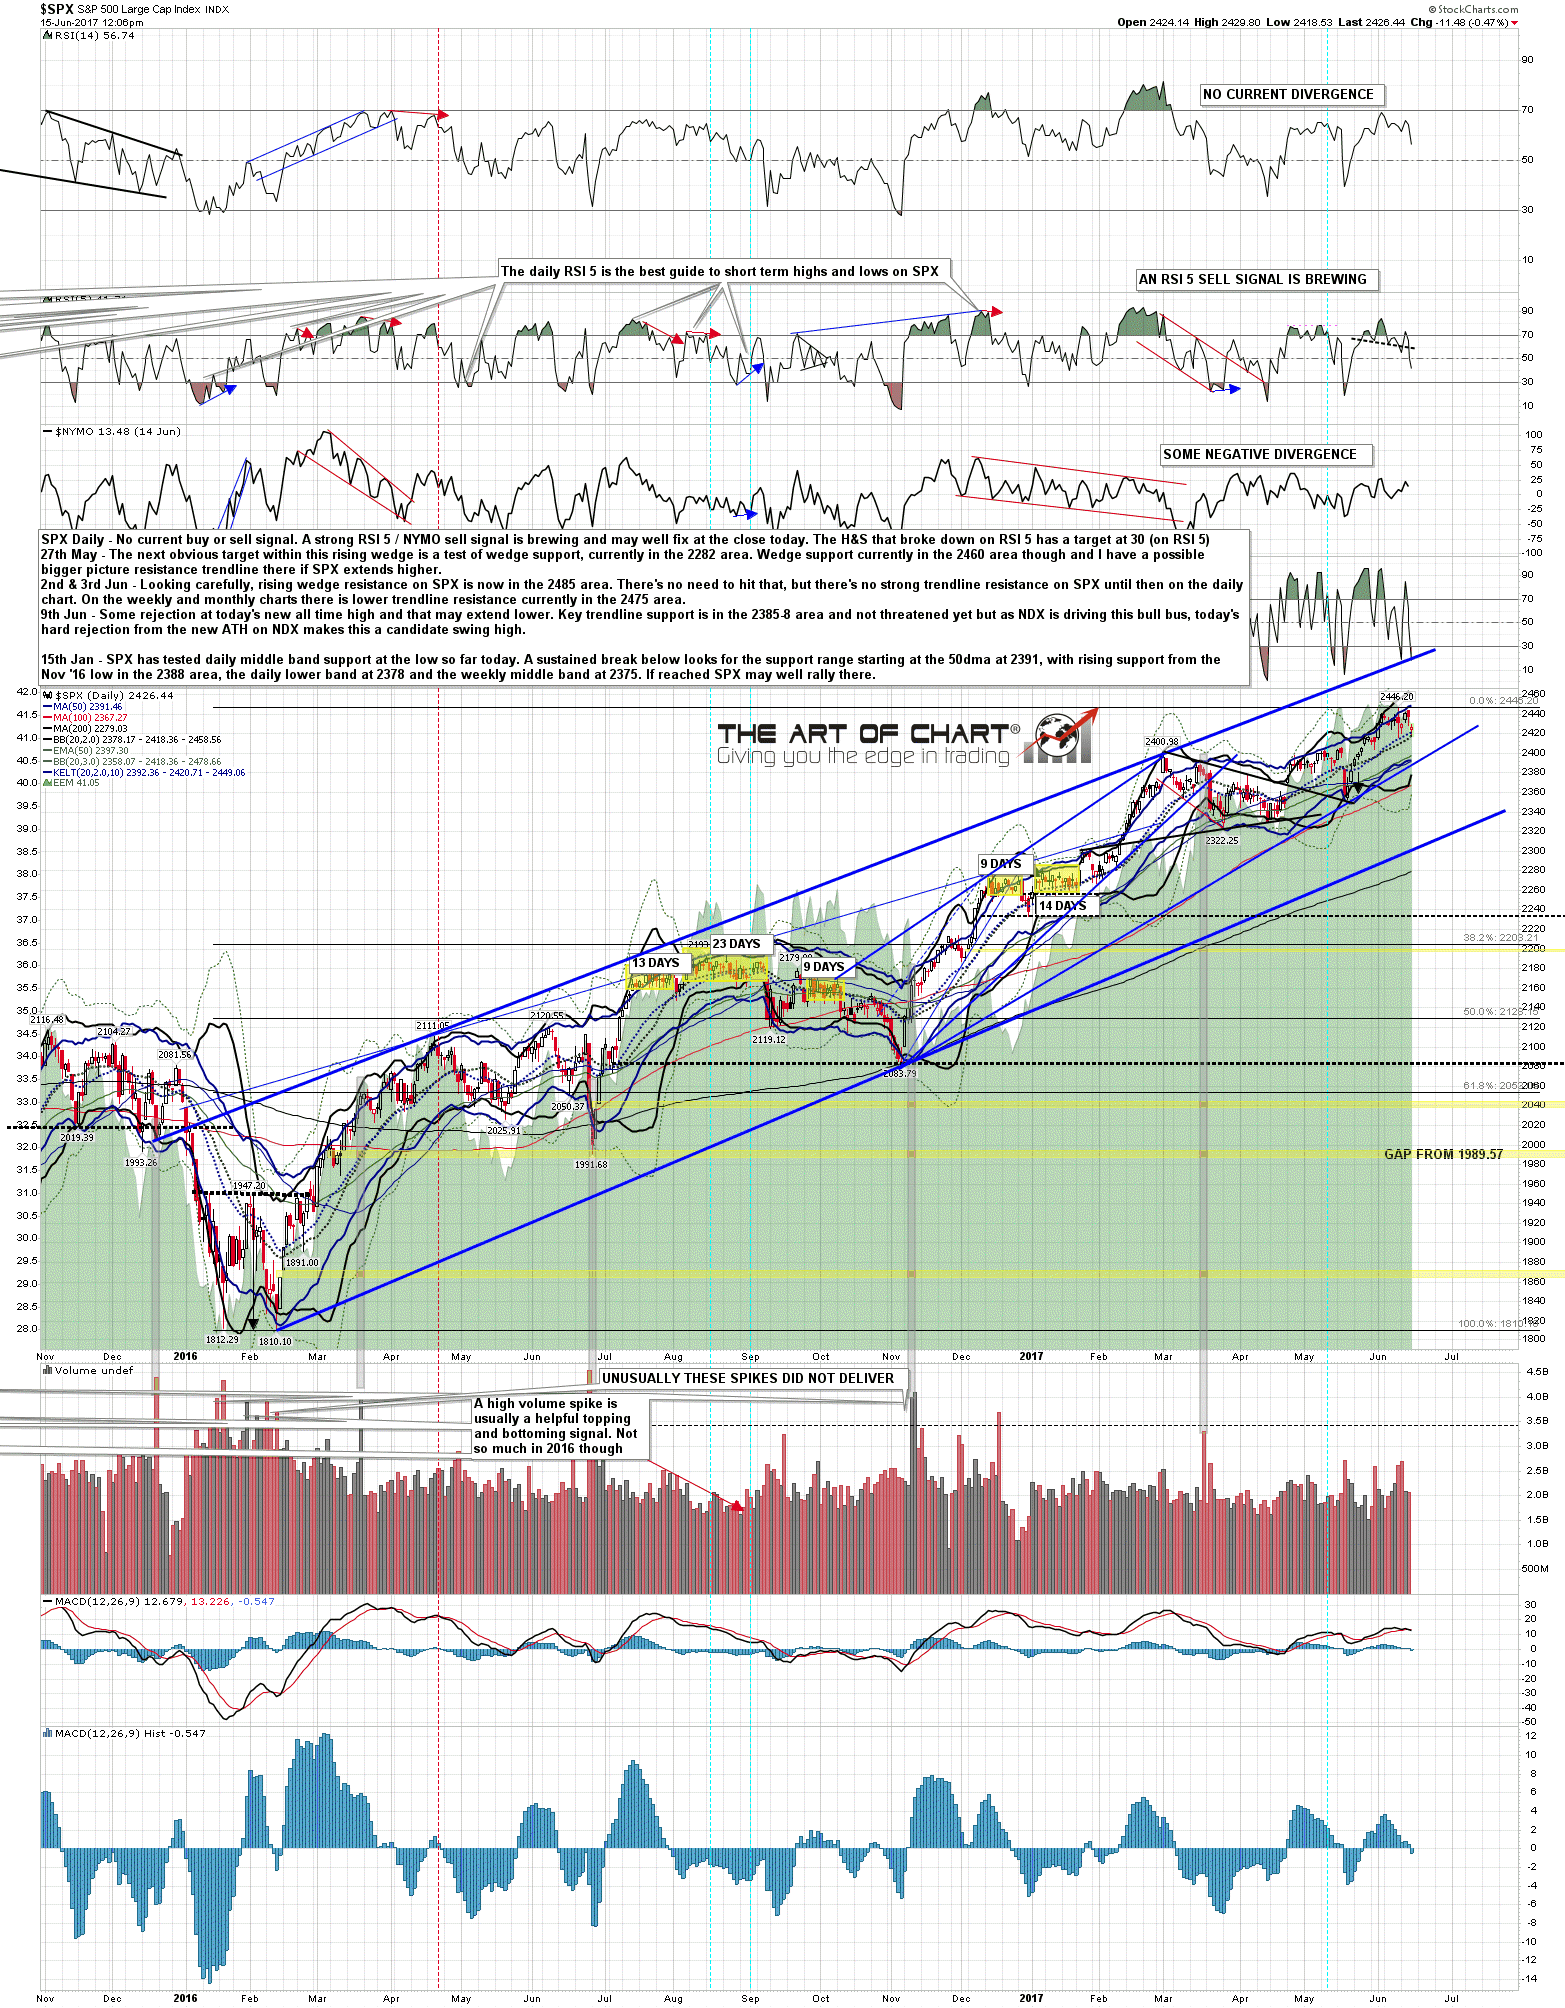
Nothing of any significance happened on the SPX daily chart. SPX daily chart: