When I started to write about the prospects for a decent rally on the 17th and 22nd June I was somewhat apologetic about even suggesting that a rally might be possible, as the background looked so grim and people were so relentlessly bearish. I was looking for strong rallies on the US equity indices and on bonds and we have been seeing both since.
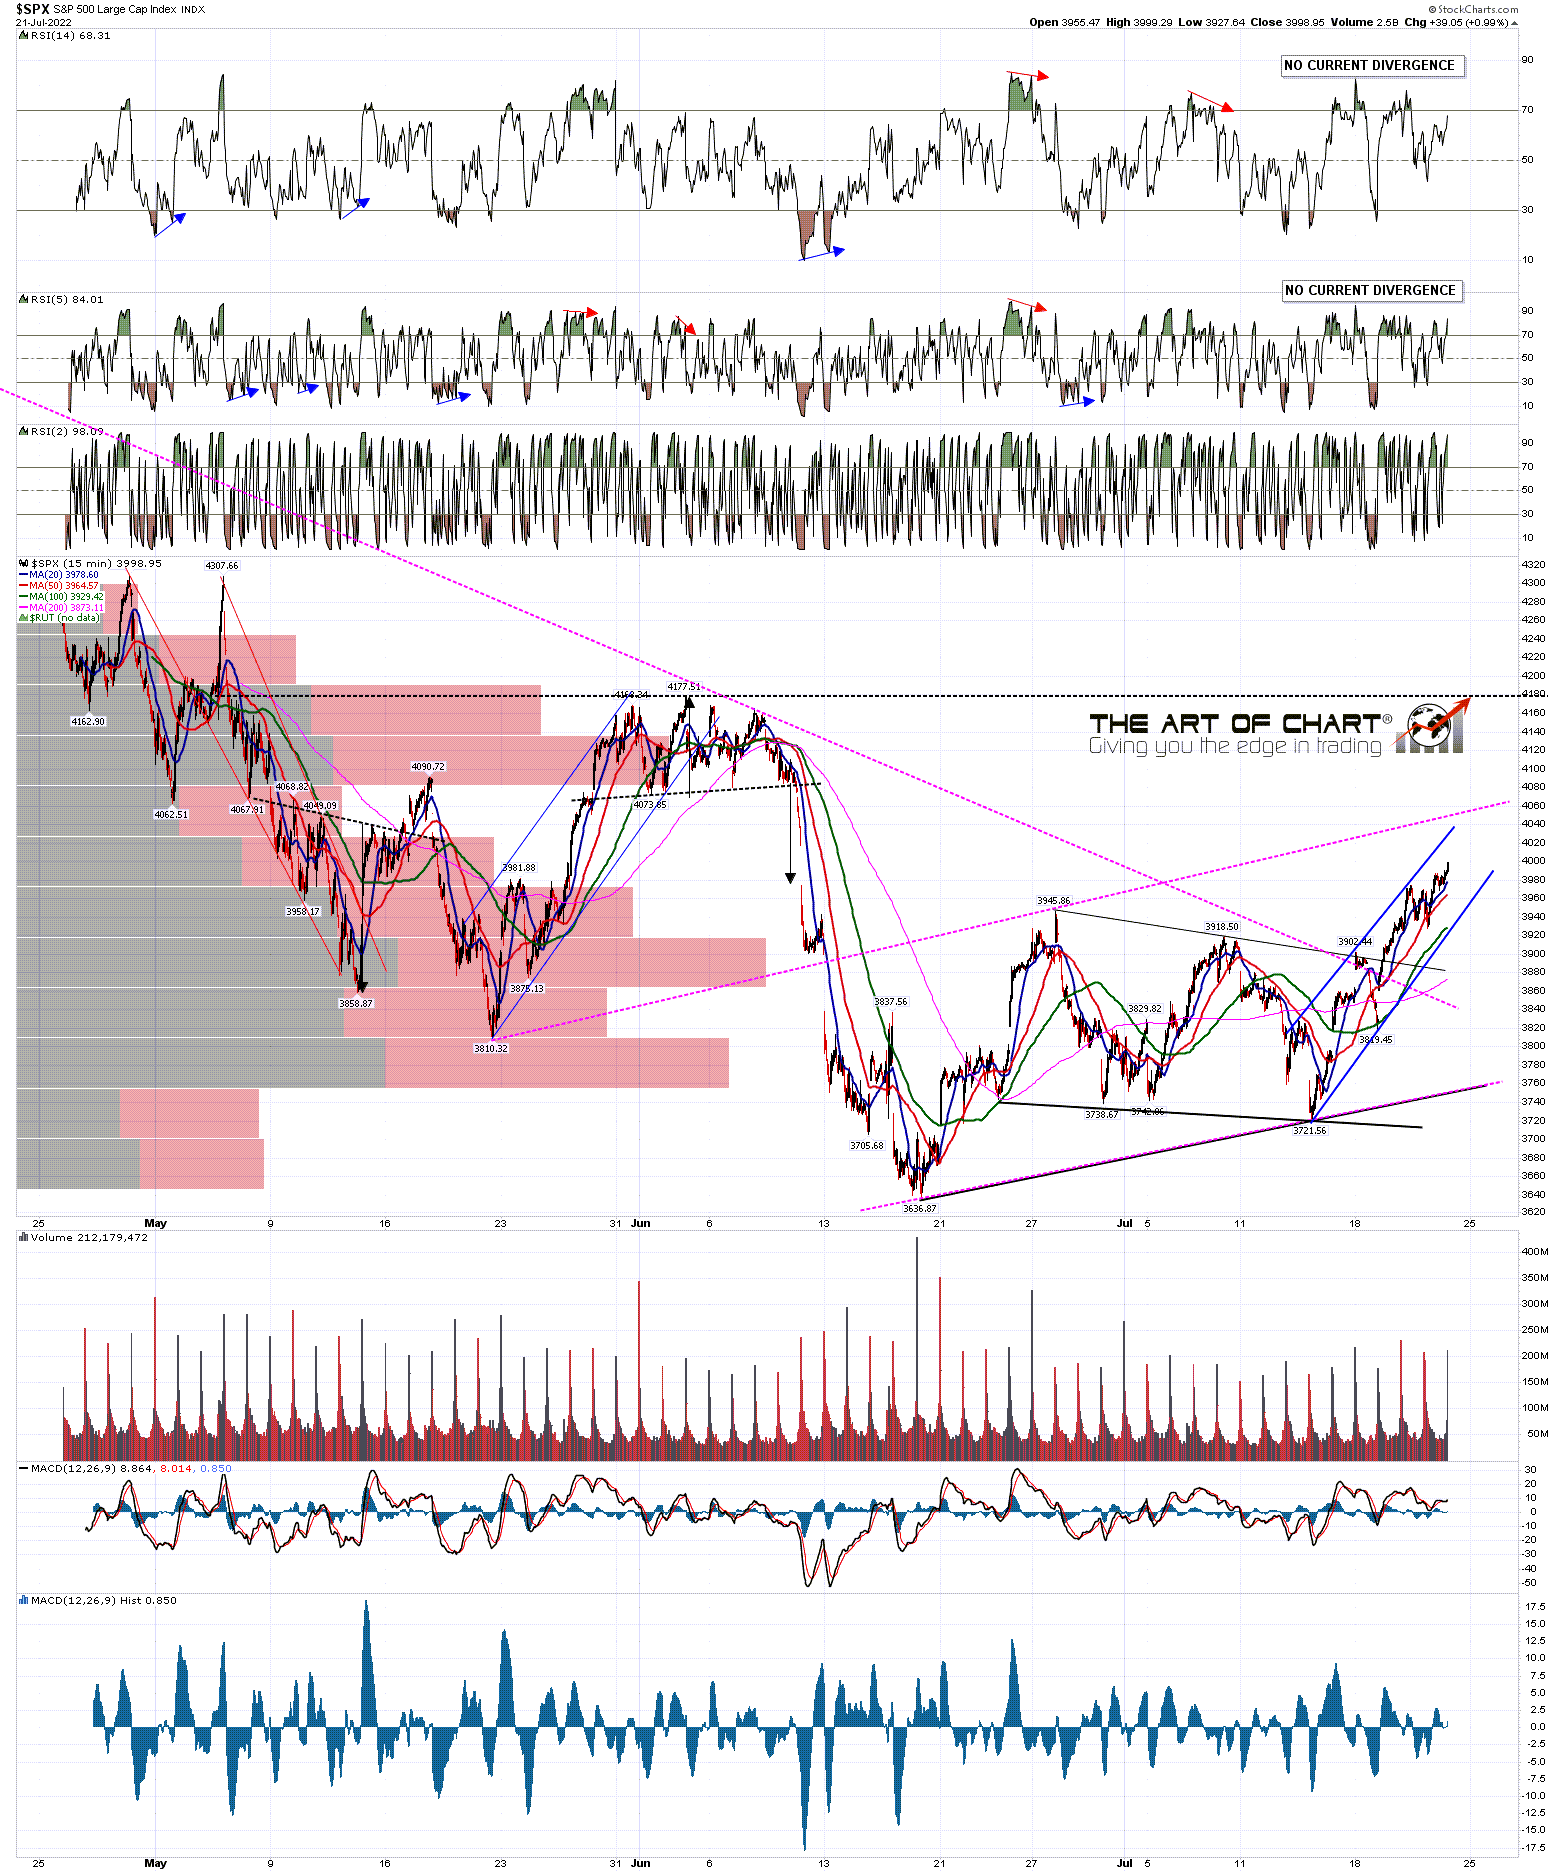
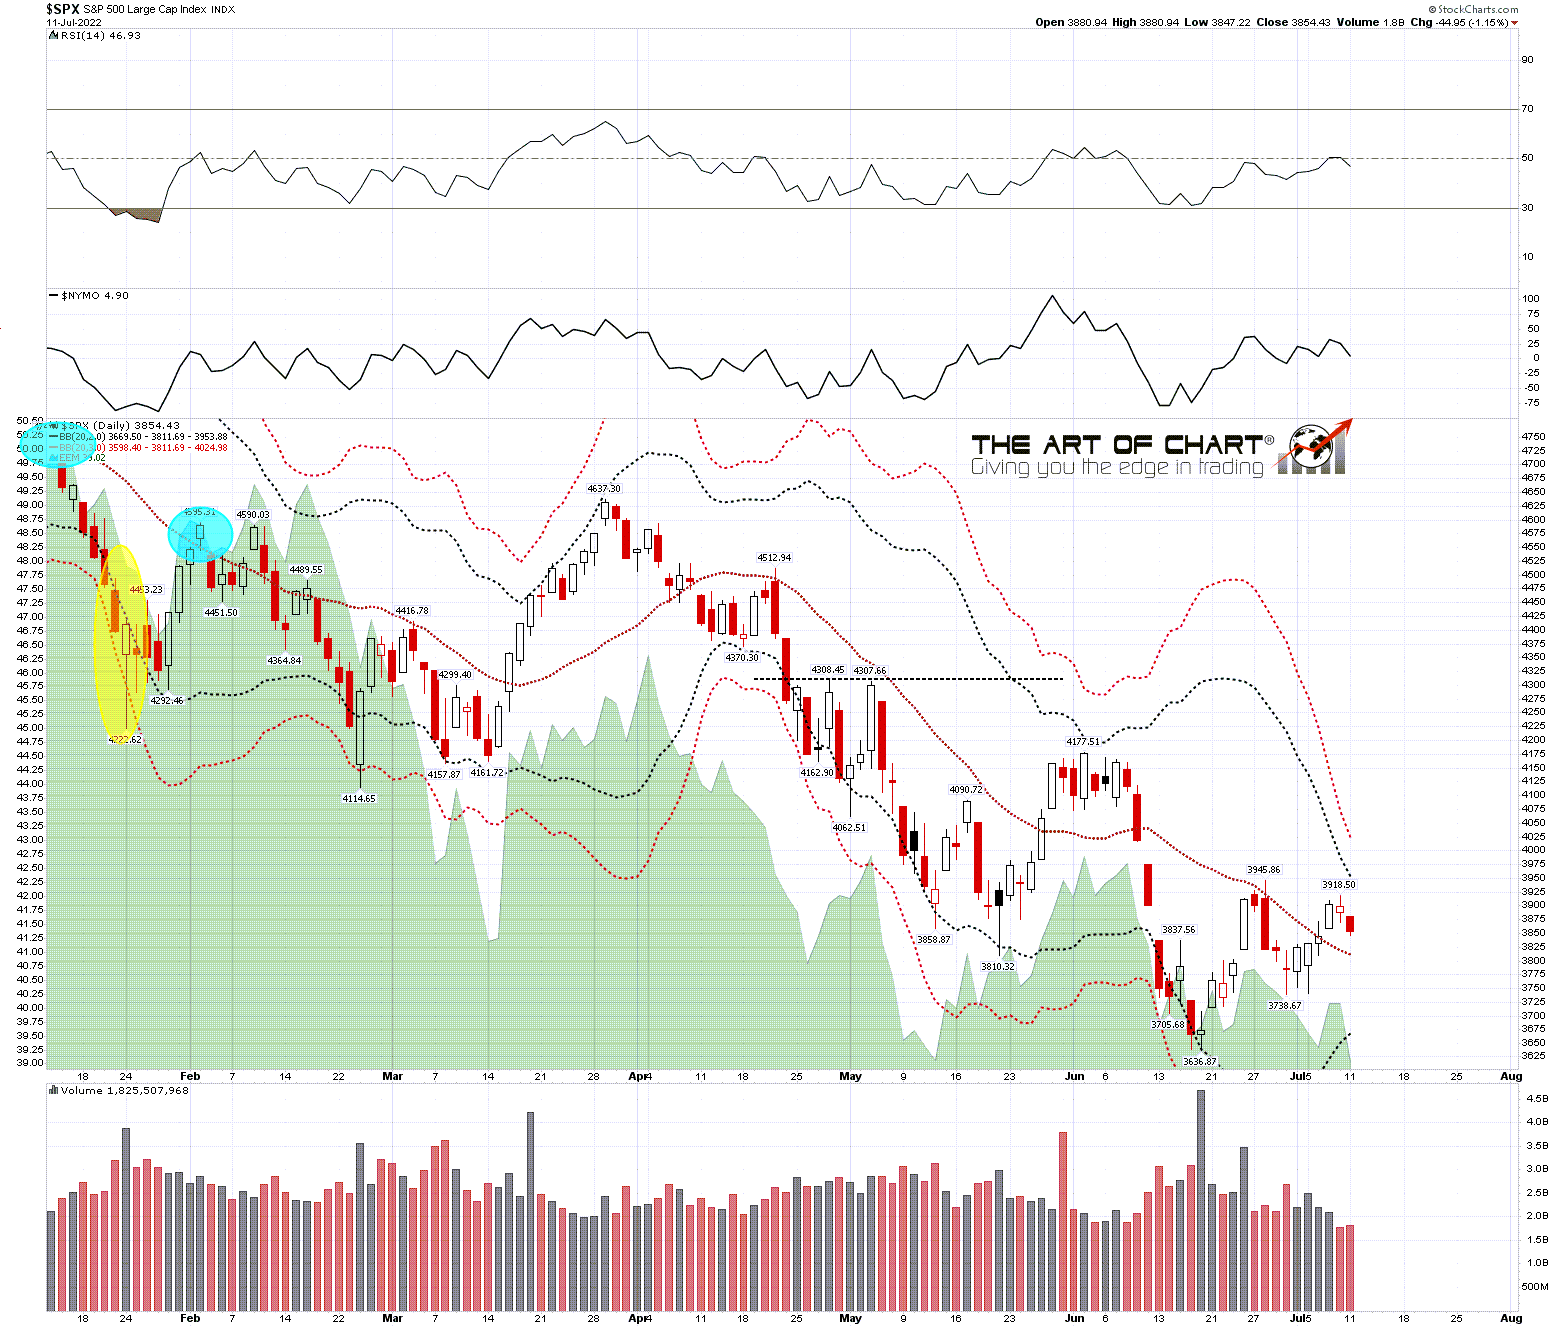
I think both may go a lot further, but SPX is now testing main downtrend resistance at the weekly middle band, with the other US indices close to important established resistance and possible IHS necklines, and there is a good chance that US equity indices may turn back down here either to form right shoulders on a series of large IHS patterns, or possibly to retest the 2022 lows, very possibly on SPX to make the second low of a double top setting up an attempt to retest the all time highs.
(more…)