SPX and Dow both reached the ideal target area for a double-top yesterday, with both making marginal new highs for 2012 and reversing. I think there's a sound technical argument for seeing a test of the 1440 area pivot on SPX, but if this is a double-top forming then ideal targets were reached on both yesterday. Here's how that looks on the SPX daily chart:
Slope of Hope Blog Posts
Slope initially began as a blog, so this is where most of the website’s content resides. Here we have tens of thousands of posts dating back over a decade. These are listed in reverse chronological order. Click on any category icon below to see posts tagged with that particular subject, or click on a word in the category cloud on the right side of the screen for more specific choices.
Euro Rising Wedge (by Springheel Jack)
Well the big news yesterday was that EURUSD held the lower trendline of the now established rising wedge there and broke up to test the current rally highs. I have a W bottom target at 1.25. I'm not wild about the short retracement into that pattern but rising wedge resistance is now in the 1.256 area so that is supporting the W bottom target. Short term the 60min RSI is VERY overbought so we might see some consolidation or retracement:
TLT H&S Target Made (by Springheel Jack)
I've been spending a lot of time looking at TLT over the last few days, and that's because while we have been seeing some interesting things on equities, the really important looking moves have been on bonds. If we see a really significant meltdown on bonds, and we're not there yet but we might be watching the start of that, then that has potentially big (upside) implications for equities. On the TLT 60min chart the H&S target was made yesterday, but there's nothing on the chart to suggest that a reversal is close as yet:
TLT Breaks Major Support (by Springheel Jack)
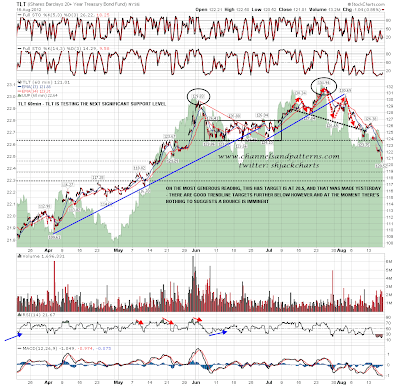
Somewhat to my surprise TLT gapped down through major support at 123.5 to 124 yesterday, and almost made it to the sloping H&S target in the 121 area. Realistically I am expecting more downside on TLT after this break, though we might first see broken support retested and possibly yesterday morning's gap filled first. There is an OK looking double-top indicating to the 116.5 to 117 area, but the quality isn't great and I'd prefer to consider the trendline setup as I think it is more likely to deliver the correct target.
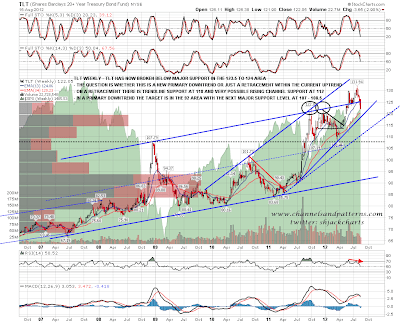
First trendline support is decent and is in the 118 to 118.5 area. This is my minimum target unless we see a strong and fast recovery over broken support, with it held afterwards. On a break below 118 to 118.5 I have possible rising channel support in the 110 – 112 area. On a break below that support trendline TLT should be in a primary downtrend, with the obvious target in the 92 area. However the next major support level is in the 107 to 108.5 area and that is particularly important as that support level is a possible H&S neckline for an H&S that would target the 84 area, subject to exactly how that formed. Any further downside on TLT will tend to support equities while it lasts, though the correlation isn't tight:
TLT Retests Major Support (by Springheel Jack)
I'm leaning bearish for the rest of the year, though very much with an open mind that it could go the other way. One thing I've been watching and writing about as very important for the bear case for the remainder of 2012 is what's happening on TLT. Major support is at 123.5 to 124, and that was tested last Thursday. TLT bounced there, formed an IHS that never broke up, and then retested the lows yesterday. If we are to see a resumption of the uptrend on bonds, this is the likely place to see that happen. If support fails however then TLT will most likely fall considerably further (targets on the chart below), and that will give a considerable following wind to equity bulls. The strength of this support level is best seen on the 60min chart:


