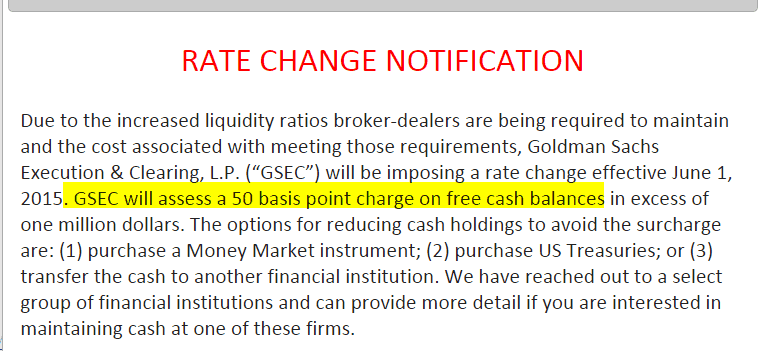
Well, negative interest rates have finally hit close to home: I got this notice from my prime broker this morning. Apparently, if I’m obnoxious enough to actually leave cash in my account, I’ll pay for the privilege.
Slope initially began as a blog, so this is where most of the website’s content resides. Here we have tens of thousands of posts dating back over a decade. These are listed in reverse chronological order. Click on any category icon below to see posts tagged with that particular subject, or click on a word in the category cloud on the right side of the screen for more specific choices.
Well, negative interest rates have finally hit close to home: I got this notice from my prime broker this morning. Apparently, if I’m obnoxious enough to actually leave cash in my account, I’ll pay for the privilege.
We’ve now seen an epic six tests of triangle resistance on SPX. I’m expecting it to break up but starting to wonder if I’ll live long enough to see that happen (j/k). Expecting to see another run at that today and hopefully this time it will break up. SPX 60min chart:

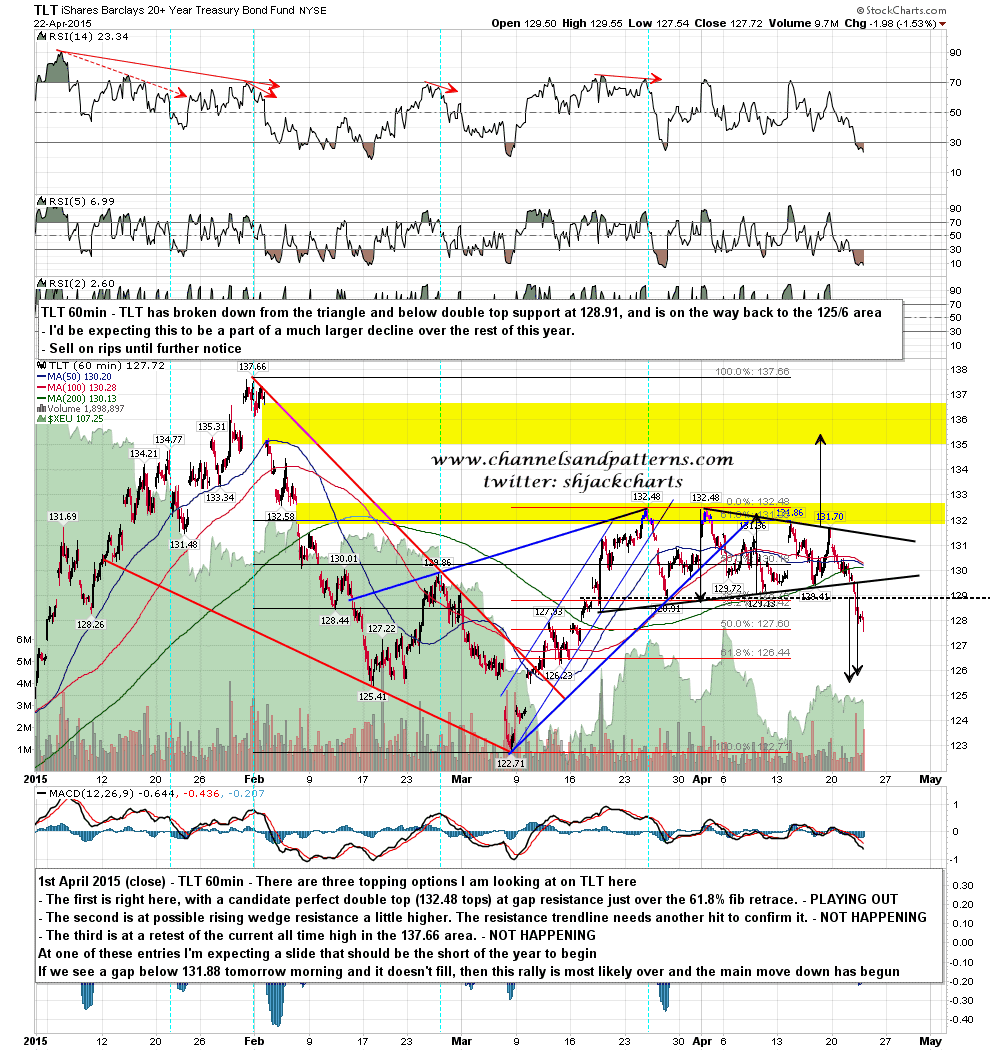
Triangles do eventually have to break of course, and the TLT triangle broke down yesterday. That move also broke the double top and I’m expecting to reach pattern targets in the 125-6 area. I would then expect to see a lower low under 122.71 on the way to targets much lower. TLT 60min chart:
I’m leaning towards a bull break over triangle resistance today. If we see a hard reversal down instead I’d note that a break below yesterday’s low at 2091.05 would trigger a double top target in the 2072 area at a retest of Monday’s low at 2072.37. A break below that would invite a test of triangle support in the 2055 area. I’d be surprised to see that but it’s worth bearing in mind.
Very late post today as I was out much of the morning and I’ve had a busy open.
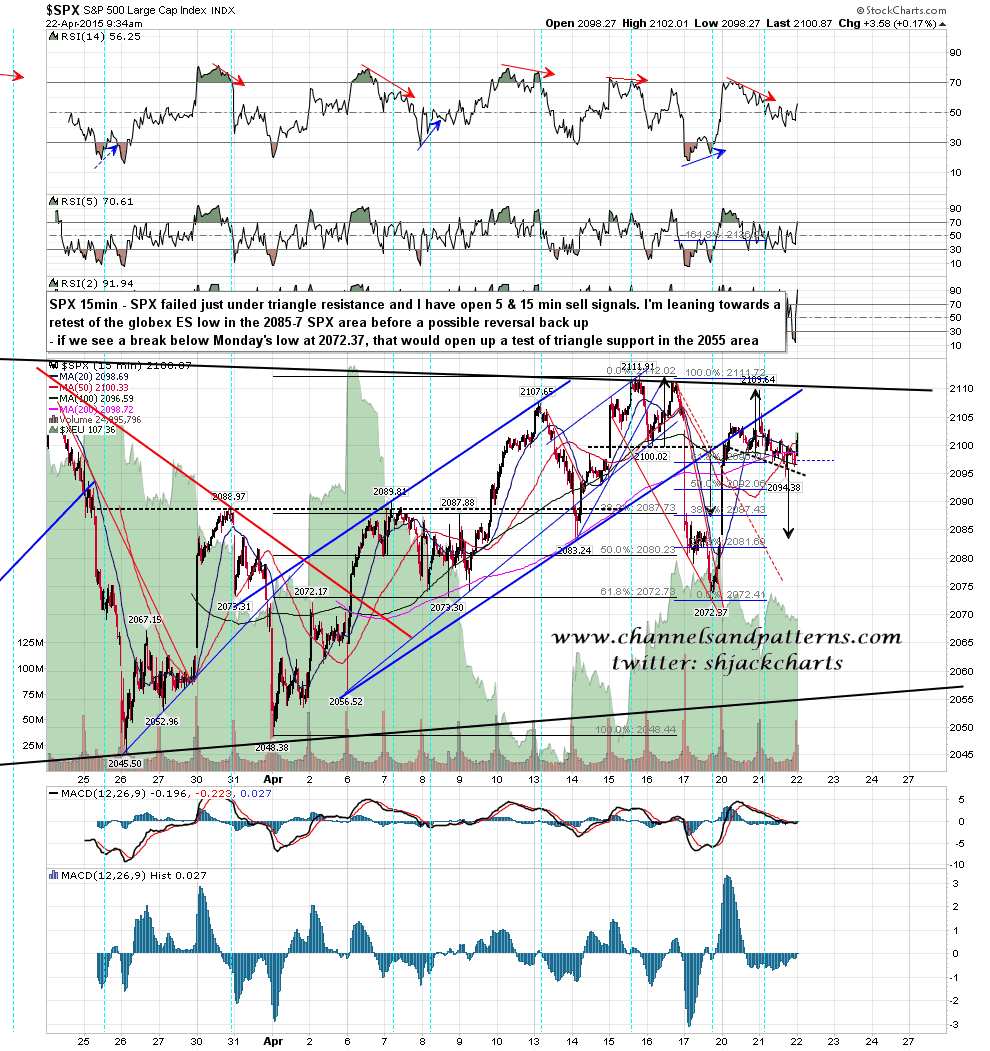
SPX failed just under triangle resistance yesterday and I have open 5min & 15min sell signals here. I’m looking for SPX to most likely test the globex low in the 2083-7 area before another test of triangle resistance. If Monday’s low at 2072.37 is broken, that would open up a test of triangle support in the 2055 area. SPX 15min chart:
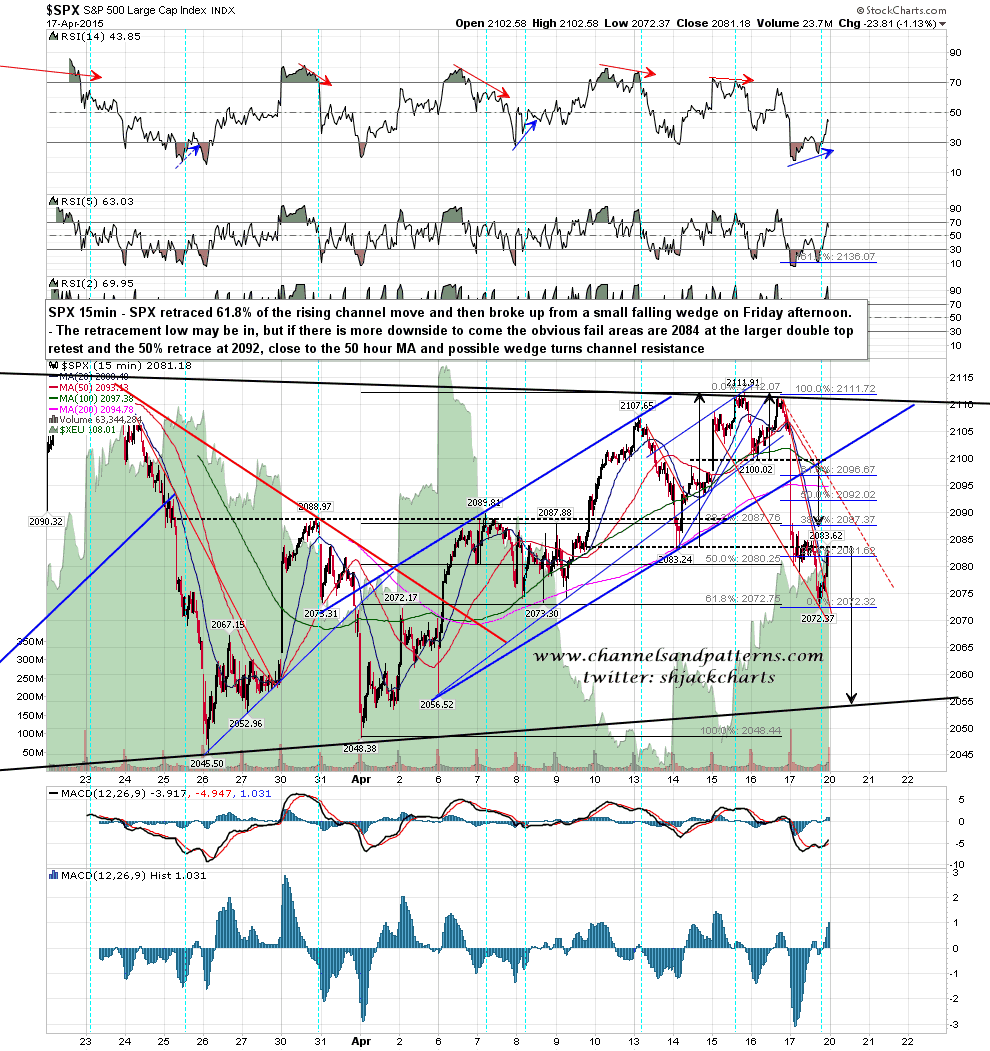
SPX fell hard on Friday, made the smaller double top target and broke down from the larger double top. Shortly after the LOD SPX broke up from a falling wedge that I called on twitter, and closed the day at a retest of broken larger double bottom support. The retracement low may be in, and if we are to see a fail without another test of triangle resistance in the 2011 area then I’ll be looking for resistance at the 50% and 61.8% retracements on the falling wedge, in the 2092 and 2096.5 areas respectively. The 50 hour MA closed Friday at 2096 and is key resistance today. SPX 15min chart:
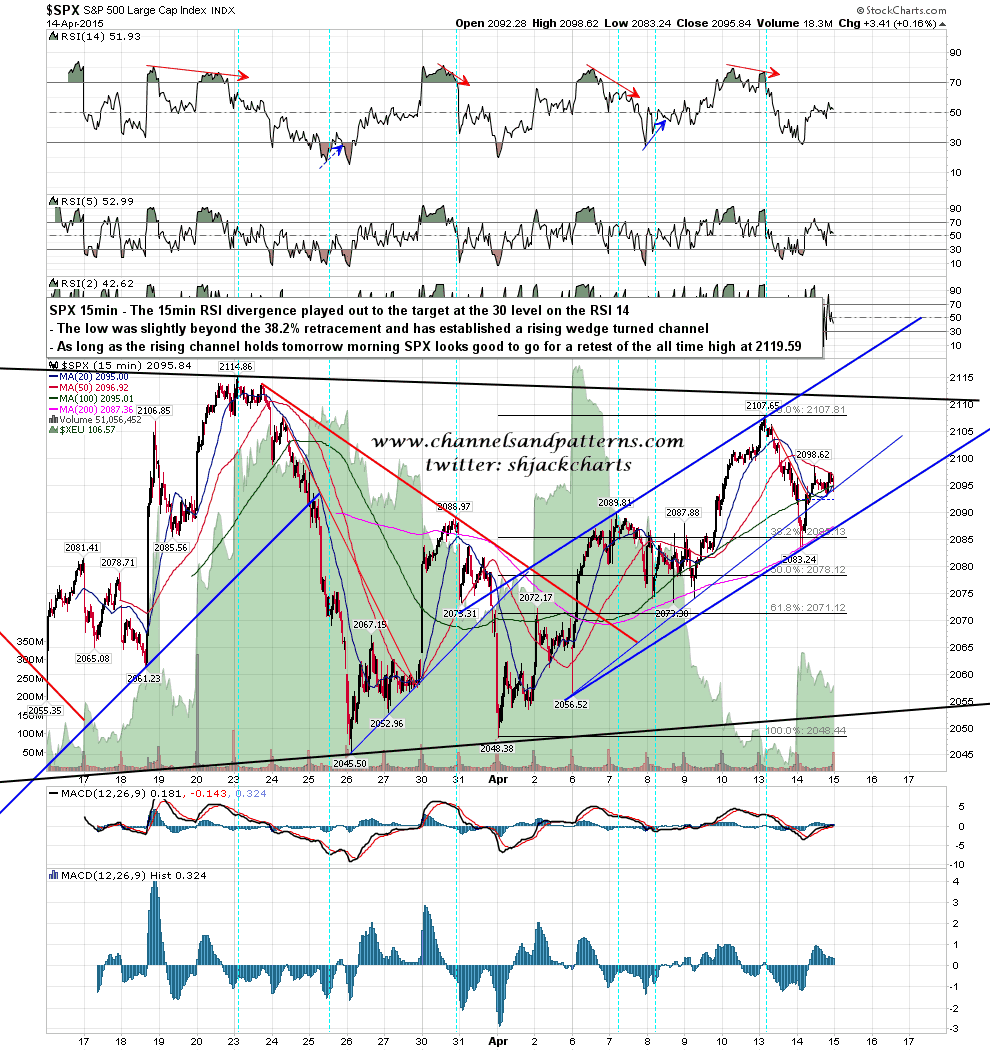
SPX found support just at the 50 hour MA yesterday and bounced from there into the close, though not with great conviction. I posted the chart below on twitter last night noting the rising channel that had been established, and that as long as that channel held this morning then the next obvious target is now a retest of the all time high at 2119.59. SPX 15min chart: