Well I was saying yesterday that the negative divergence on the SPX daily RSI 5 and NYMO was giving the edge to a bearish resolution to the range and we may at last be looking at the start of the retracement for this big wave up from the 1737 low. (more…)
Slope of Hope Blog Posts
Slope initially began as a blog, so this is where most of the website’s content resides. Here we have tens of thousands of posts dating back over a decade. These are listed in reverse chronological order. Click on any category icon below to see posts tagged with that particular subject, or click on a word in the category cloud on the right side of the screen for more specific choices.
Living on the Ceiling
SPX has spent the last three days trading close to the weekly upper bollinger band, and closed yesterday a point above it. I gave the maximum closing range this week without a rare and bearish punch above the weekly upper band at 1880-5, and if anything that looks a little high. With ES at 1884 at the time of writing, further upside into the close today looks unlikely. SPX weekly chart:
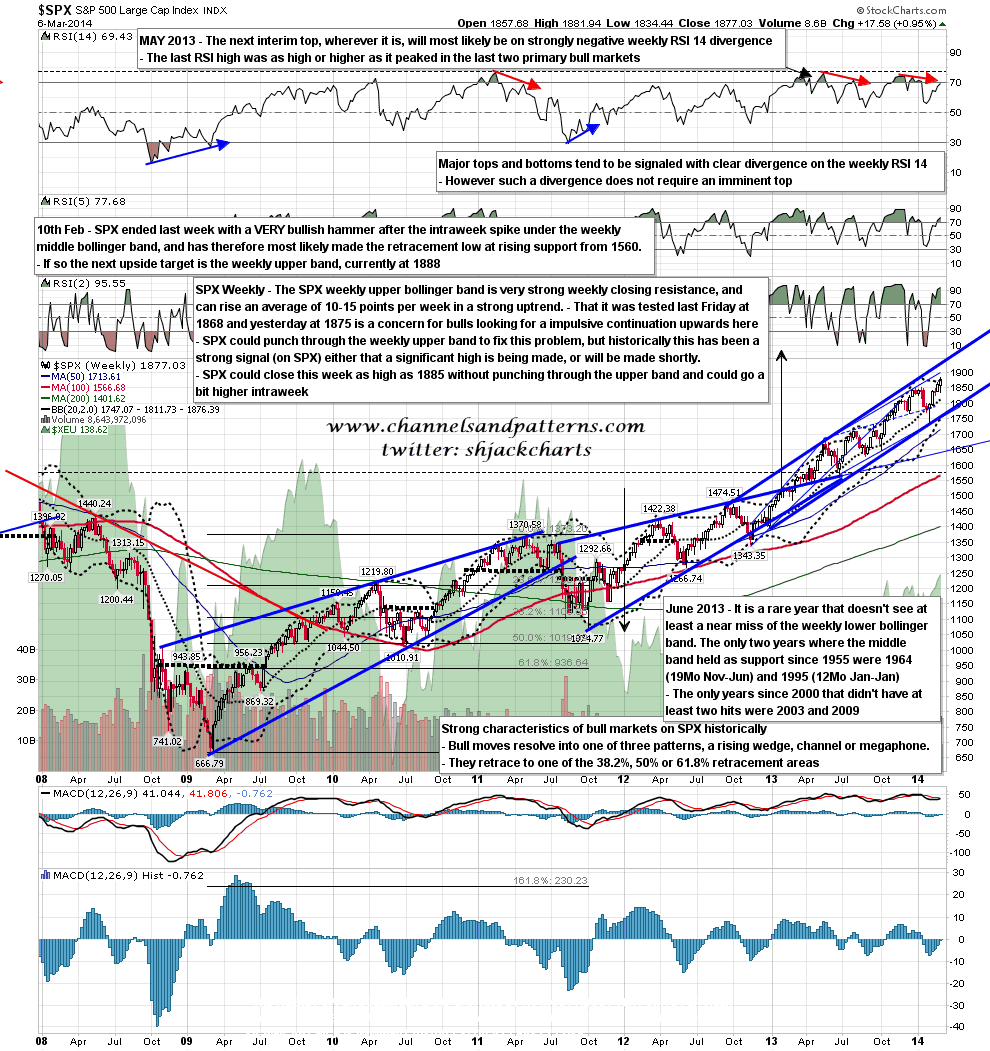
Max Headroom Today 1870-5
After a couple more exploratory pinocchios through 50 hour MA support at the open yesterday morning SPX took the green pill and broke back up through the ES 50 hour MA. I was grumbling on Wednesday morning about the lack of a clear support trendline for this move up, and even though the bears ended up getting their clocks cleaned (yet again) yesterday, my urgently required support trendline has now been established as I now have rising channels from the Feb low on both SPX and Dow. This will give us a clear marker for when this move is topping out, which as I have mentioned, may be very soon. SPX 60min chart: (more…)
Testing the Water
Another day of consolidation yesterday with two more tests of key short term support at the SPX 50 hour MA. On the second test there were significant intra-hour pinocchios below it which was new, but the hours closed safely back above. The pattern setup on the SPX 60min leans bearish but could still go either way this morning. The triangle I was looking at yesterday morning broke up and was then retesting hard at the close. For today I would expect that either to break up to a marginal new high, or break down to test the triangle target and possible H&S or double-top neckline at 1824/5. The RSI and trendline setup are leaning towards the bear outcome, and I have mentioned many times before that triangles have a very tendency to make a false break before the real move begins in the opposite direction. SPX 60min chart: (more…)
SPX Primary Pattern Update
I took some time yesterday night to consider the overall bull market pattern setup here from the 2011 low. There is something that has been concerning me seriously on my weekly charts, and that is that I still have no pattern from the 1343 low, and the last low of course was very clearly on a trendline from the 1560 low. Why is that important? Well I’m going to do a post explaining my thinking here in detail at the weekend but suffice it to say for now that my wedge target at 1965 is a wedge target regardless of degree, but the reason I have been expecting the target to be reached is because my assumption has been that the rising wedge from the 2011 low from which that target is taken is a primary bull market pattern. If that was the case, then the following primary bull market pattern should start from 1343, and I can only see a secondary (one degree below) pattern starting there. If that pattern is a secondary pattern, then most likely the rising wedge from the 2011 low was also a secondary pattern. (more…)
