I’m very pleased to announce some more improvements to SlopeCharts.
First, you’ll notice some new items in Drawn Objects. Well, they’re not new per se, but we’ve made the functions more granular. I’ve highlighted the icons below – – from left to right, there is rectangle, oval, rectangle-with-text, and oval-with-text. You can probably figure out what they do, but the point is that if you just want to draw a shape and definitely aren’t bothering adding text, you can save an extra step by just using the “pure” shape tools. (Please remember to press Ctrl-F5 to force a reload of the page so you’re sure you’ve got the latest version).
![]()
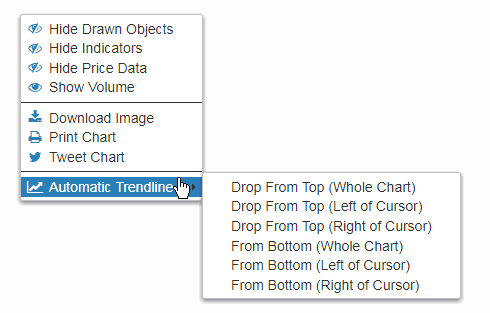
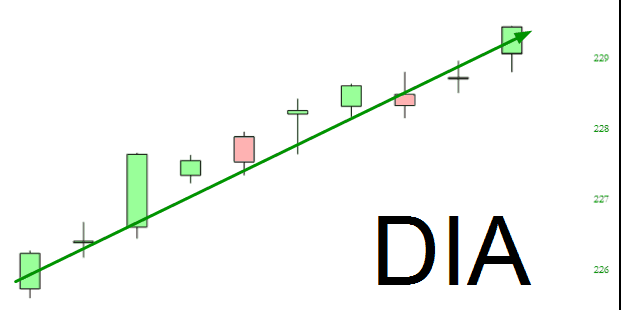
The much bigger news is automated trendlines, however: