Slope of Hope Blog Posts

Slope initially began as a blog, so this is where most of the website’s content resides. Here we have tens of thousands of posts dating back over a decade. These are listed in reverse chronological order. Click on any category icon below to see posts tagged with that particular subject, or click on a word in the category cloud on the right side of the screen for more specific choices.

So Long!

By -

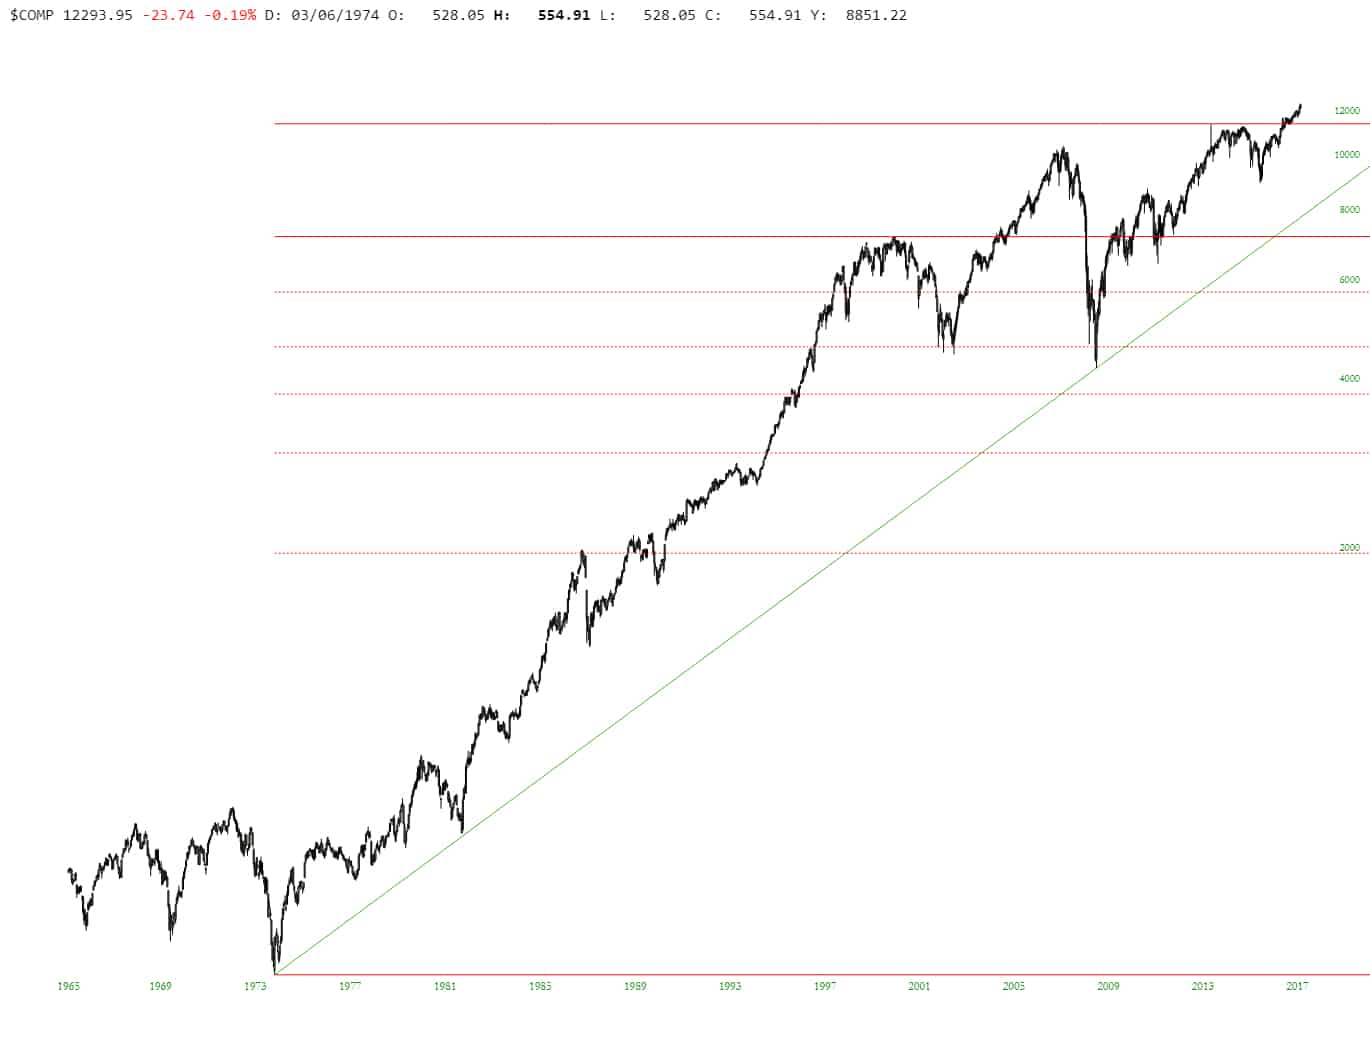
Another day, another SlopeCharts improvement. We have deepened the historical data for indexes and added a couple of new ones. Those of you who are Plus subscribers can, of course, fetch my own list of 36 indexes (and the mark-ups) via the Publish feature to which you have access (just look for my watch list cleverly titled “Indexes“). Here’s one new index, the Dow Jones Composite, which goes back to January 1966.

slopechart_$COMP

(more…)

So Why Bother?

By -

I got a well-meaning email from a well-known Sloper who was intrigued at my creation of SlopeCharts. Since web-based charting has been around for many years, and quite a few companies (with lots of money and lots of employees) have already done it……..why bother doing it again? Why re-invent the wheel?

My initial motivation, as I’ve explained in earlier posts, was to give myself a charting platform that I liked. I never intended to re-create charting. As the saying goes, “been there, done that”, and it’s a lot of work. However, I tried – – I really, really tried – – to find something out there that I liked, and I hated all the offerings. Some were better than others, but I didn’t really like any of them. So I set about on my task. (more…)

Time Periods in SlopeCharts

By -

I am delighted to let you know about another improvement in SlopeCharts. It may seem trivial, but it has been by far the most requested improvement:

1005-period

Yep, now you can choose how much historical back data to fetch (For PLUS users, this includes pre-fetching!). I didn’t include this feature at first, because I’m an All Data kind of guy. However, some people prefer short time periods, and obviously you’ll enjoy faster load times with less voluminous data.

There’s really not much else to say……jump to SlopeCharts and try it out by clicking the Preferences icon on the extreme right.