
Well, I know I’m not the only one who is glad the election is over. Truth be told, as glad as I am to see price moving around again after this summer’s lethargy, I have my fingers crossed that volatility dials it back a little from here because it’s a bit too much for me. BUT, after just one week, conditions have changed considerably so a quick review is in order.
Coming into Election Day, there was a significant amount of hedging going into the uncertainty of Nov 8th was evident by the high SKEW readings and Equity Put/Call ratios. Since then, the SKEW has returned to mid-levels and Equity Put/Call is not far behind.
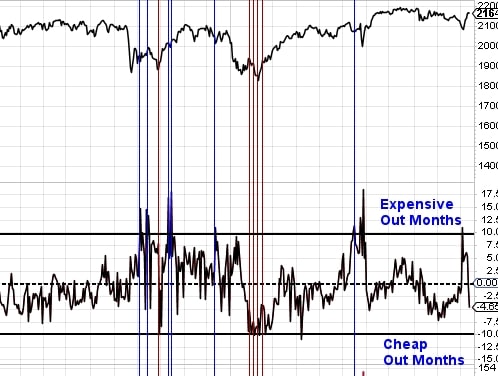
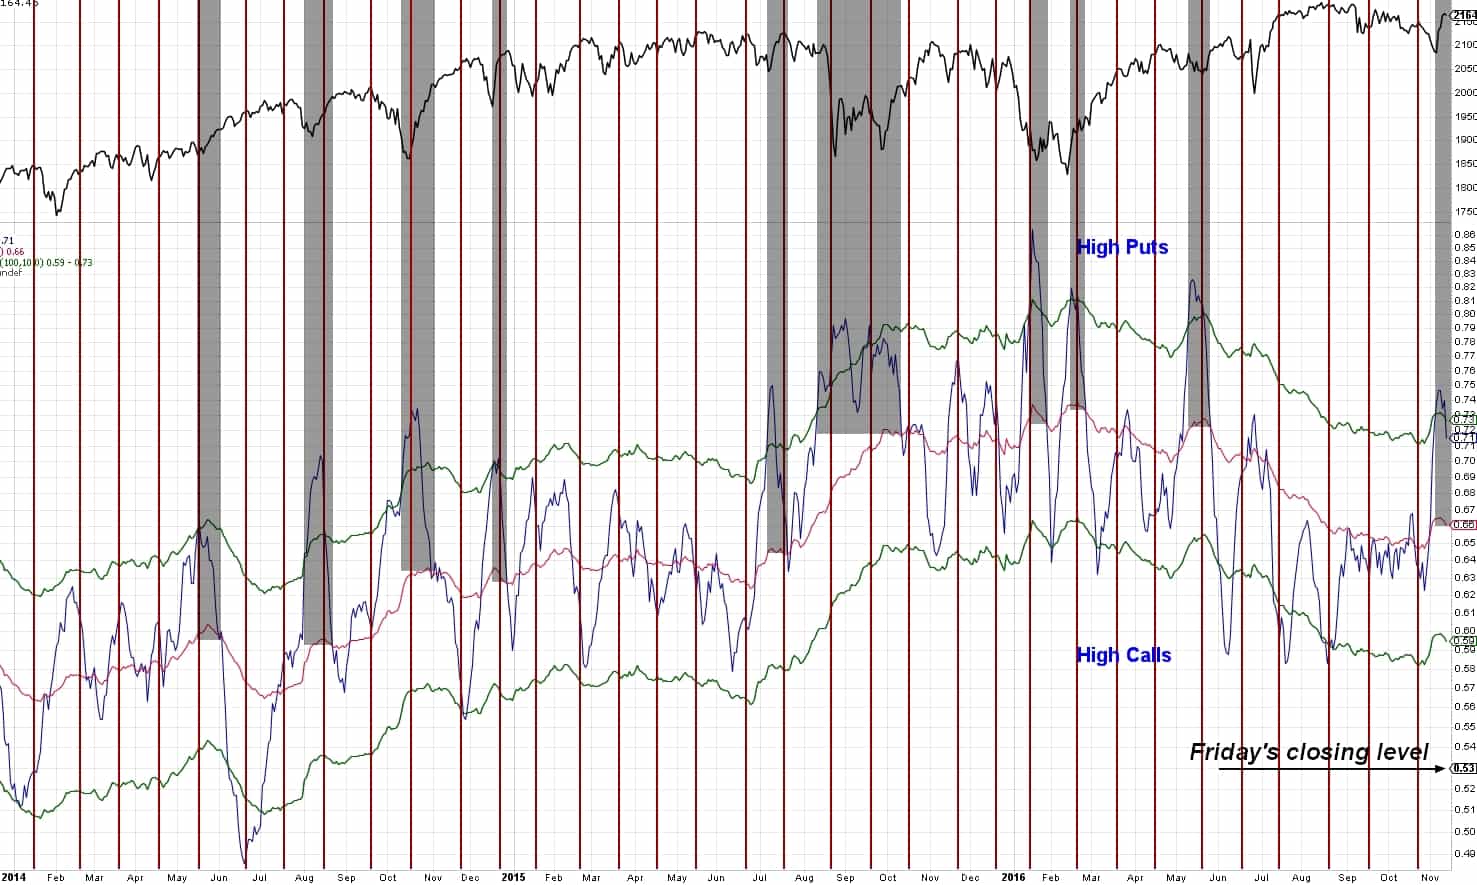
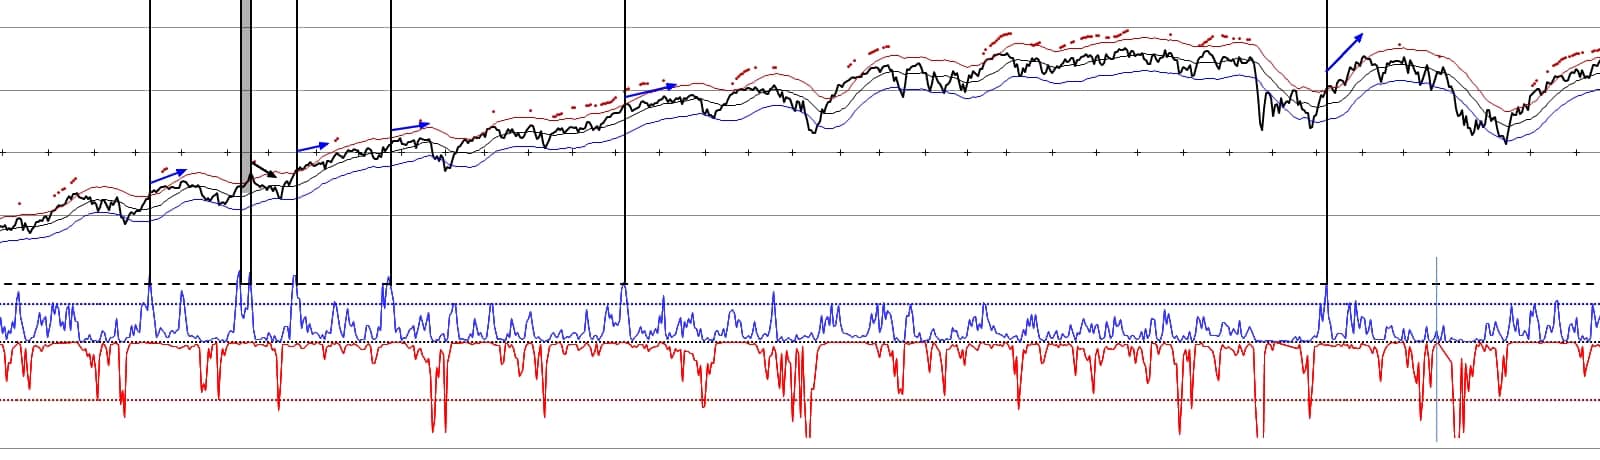
I’ve highlighted above the times in the past couple of years when the Put/Call ratio was beyond the upper boundary I set and the price action that occurred while the ratio mean reverted to the 100MA. Most of the time, a high boundary break coincided with a large rally in the SPY, less commonly, it was forecasting a large sell off.
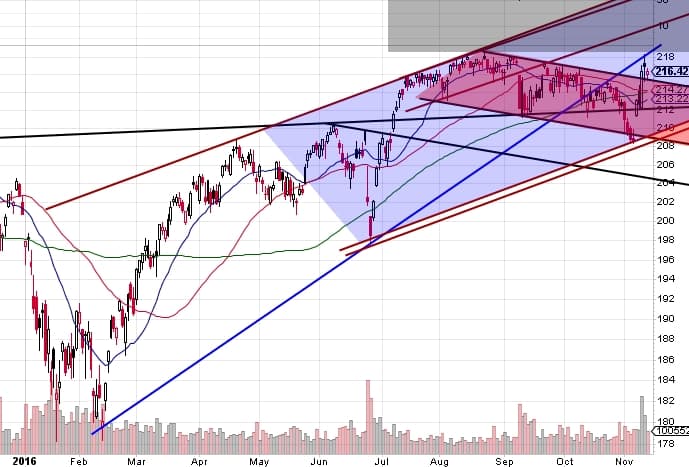
Looking at the SPY, structurally, it would appear that price has broken out of a large bearish channel and established an even larger bullish channel. These well-established trendlines tend to endure in importance so the upper downtrend line of the bearish channel will be very important this week (approximately $215). I suspect it won’t break, but if it does, it opens up trade back to the large channel’s low around $210. It would seem SPY has set the stage for trade to continue to new ATH’s, but let’s take a look under the hood.
One measure I track is the percentage of stocks greater than their upper Bollinger Bands. As of Friday (Thurs also for that matter), over 40% of risk on stocks (discretionary, financials, industrials, and technology) closed above their upper Bollinger Bands (20-day, 2 standard deviation setting). I had to go back to the days of QE from 2010 to 2013 to find another instance that high and I only had 4 instances.
BUT, slackening the requirement slightly to 30% gave me 17 occurrences. Take a look (you can click any of the charts to see a larger size):
Apr 2010 through March 2013
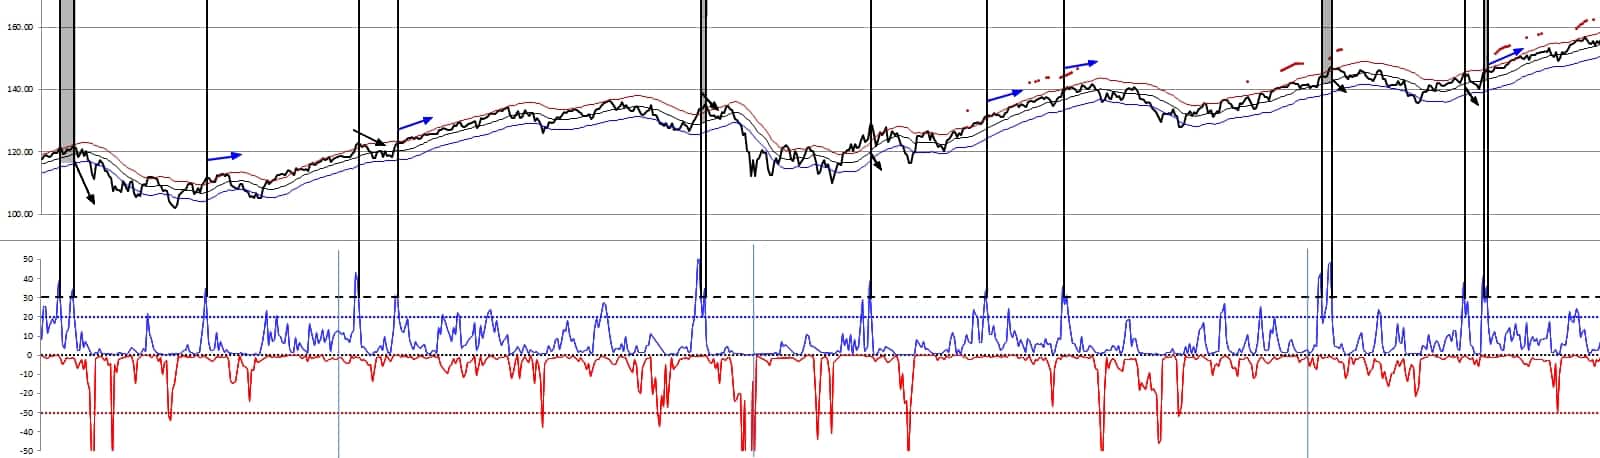
Apr 2013 through Apr 2016
Here are the stats:
Since 2010, SPY has had a similar condition 17 times.
9 of those times (53%), SPY traded in a shallow uptrend for the next couple of months.
3 times (17.6%) SPY topped immediately and dropped 5-15%.
1 time (5.8%) SPY doubled the rally already achieved (2015).
5 times there was a subsequent BB pop within the next week or two, but 4 of those 5 times then suffered a 3-5% pullback after the second pop.
No trade for this post, but I’ll see you all in the comments.
