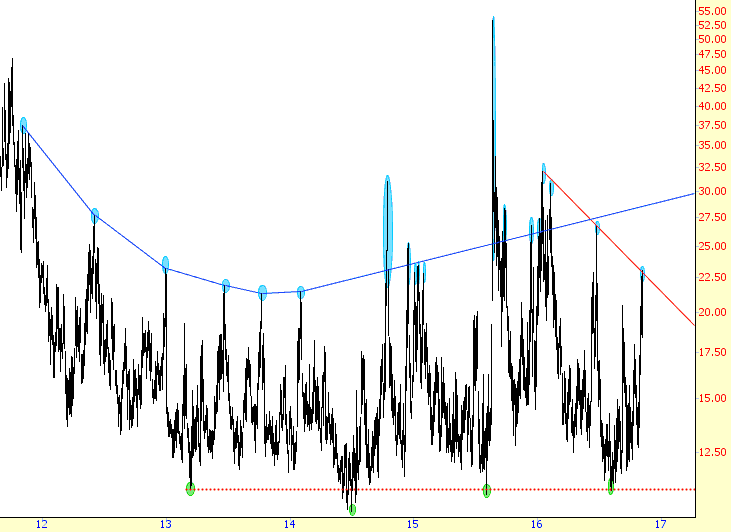
Over the past six years or so, the VIX has been carving out an enormous saucer-shaped pattern. I’ve been dutifully tinting the price peaks (that is, the mini-panics) all along the way, and it forms a pretty interesting, if highly irregular, pattern.
Slope of Hope Blog Posts
Slope initially began as a blog, so this is where most of the website’s content resides. Here we have tens of thousands of posts dating back over a decade. These are listed in reverse chronological order. Click on any category icon below to see posts tagged with that particular subject, or click on a word in the category cloud on the right side of the screen for more specific choices.
The Presidential Cycle
The market has been very readable since before Brexit. It was over bearish and due for a post-Brexit rally  . It was due for a drop to test major support
  , but amid last week’s highly broadcast 9 straight down days and the renewed Clinton email scare, it was due for a bounce from over bearish status
  . However, this is not the end of the story. We remain on a test of major support unless certain upside resistance parameters are taken out. Beyond this highly volatile phase, we are likely either going to confirm major support and potentially break out to new highs or a bear market will ensue.
Figuring prominently in the short-term is the US election. Here is NFTRH 420’s weigh-in on something I almost never want to comment on but did in this week’s report, given Donald Trump’s ‘overbought’ status last week.
The Presidential Cycle (graphic sources: FactSet.com) (more…)
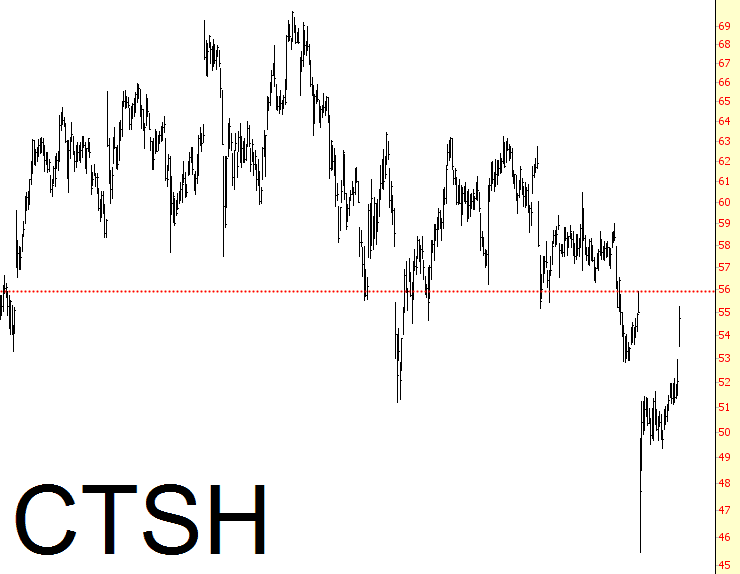
Short Cognizant
The Powerful Rally Arrives
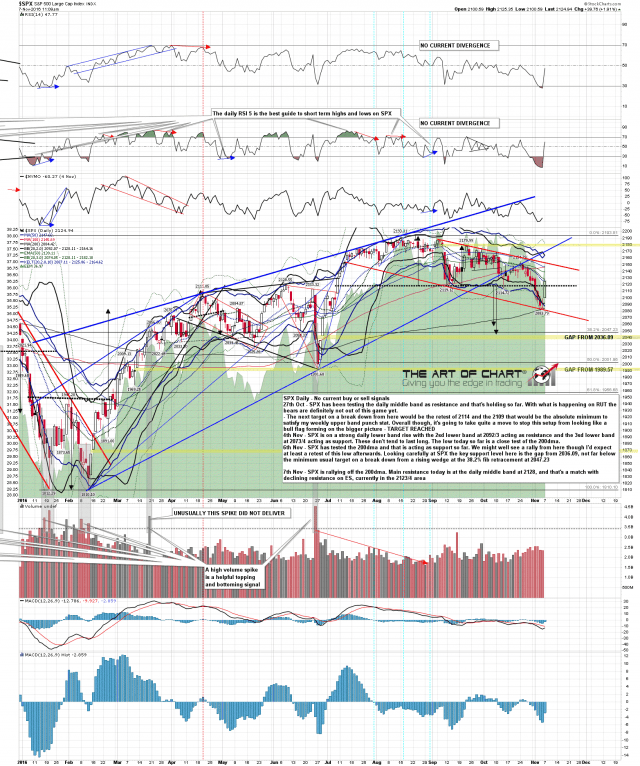
I was saying on Friday morning that the type of lower band ride that SPX was on tended to end with a powerful rally, and that an obvious place to start such a rally was at the test of the 200dma, and here we are, looking at a powerful rally off Friday’s almost perfect test of the 200dma. So far today this is a trend up day on SPX and that may well be the case all day, though SPX is now very close to testing important double resistance at the SPX daily middle band and 2128, with ES declining resistance at 2123/4. It’s possible that this rally might come to an abrupt stop there, so I’m watching that test with great interest. SPX daily chart:
Throbbing Election
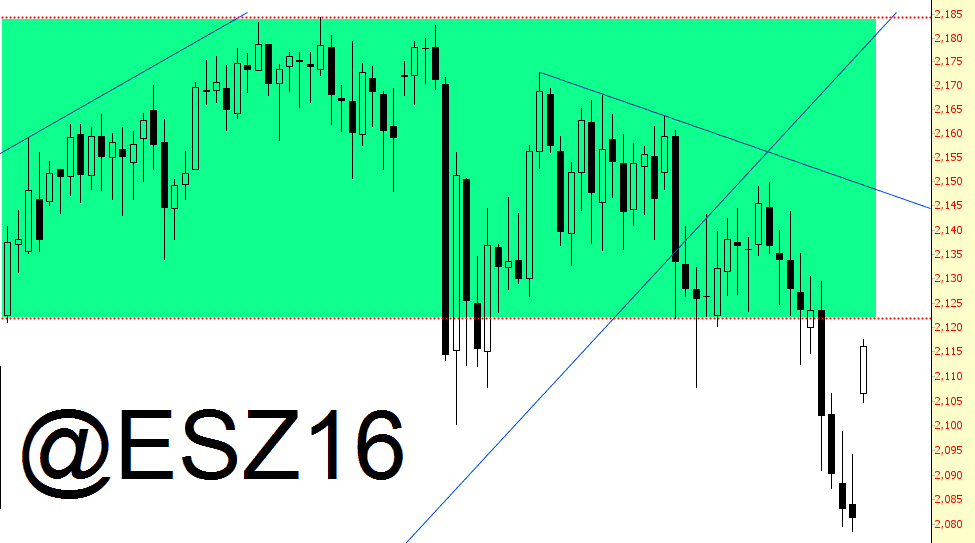
For those in the public that are taking advantage of this fantastic bargain opportunity, I would quietly remind anyone who will listen (which is nobody) that there is a very small pocket of overhead supply that would need to be overcome to create a renewed bull market. I’m not sure if you can make it out, but I’m tinted it in green.


