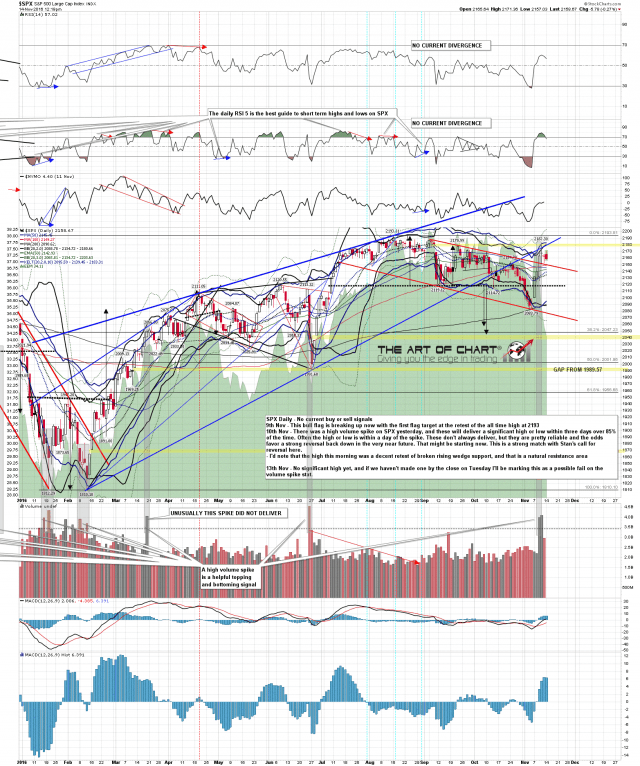
There were two back to back volume spikes on the daily SPX chart last week and I’m looking for that significant high. We could see it here but unless SPX can break down through the 2154 (2150 ES) area support that held on Friday the short term pattern setup favors a retest of the current rally high in what might then be the second high of a small double top: SPX daily chart:
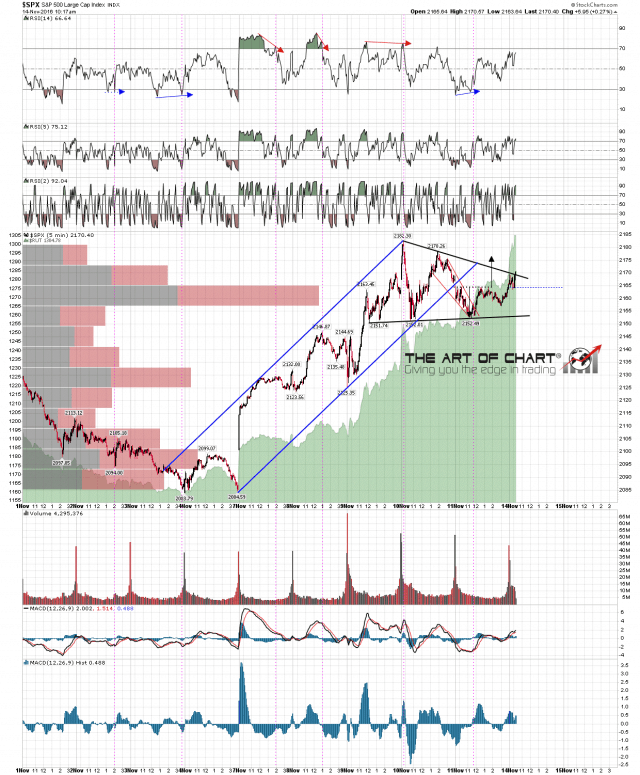
Both SPX and ES have formed triangles and they aren’t quite the same but they have both broken up, and if that is a true break up, then this is the backtest before the thrust up from the triangle that should at least deliver a retest of the current rally high. SPX 5min chart:
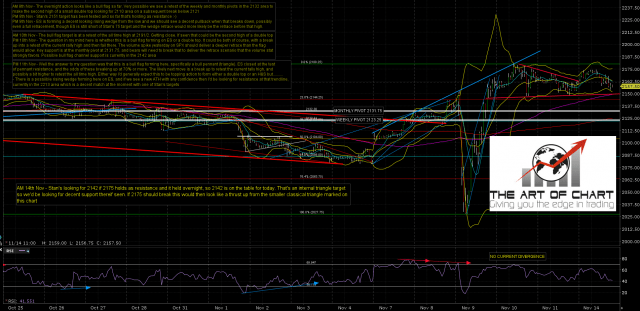
On ES the key level that needs to hold today is 2150 again as that is triangle support. Holding so far this morning. A break down through 2150 invalidates the first break up. ES Dec 60min chart:
The key today is the same support area that dominated Friday. If SPX can break Friday’s low then the downside opens up. If not then a retest of the rally high should be next & I’d be looking for possible resistance there.


