Slope of Hope Blog Posts

Slope initially began as a blog, so this is where most of the website’s content resides. Here we have tens of thousands of posts dating back over a decade. These are listed in reverse chronological order. Click on any category icon below to see posts tagged with that particular subject, or click on a word in the category cloud on the right side of the screen for more specific choices.

SPX Outlook to 2020 U.S. Presidential Election

By -

I’ve written about the SPX:VIX ratio many times in the past. I’ve mentioned, as recently as November 13th, that it will be necessary for the bulls to hold price on this ratio above the 150 level in order for SPX equities to continue their rally with little volatility to impede this rise.

This post will take a look at one possible scenario that could see the SPX reaching a price of 2700, or so, by 2019, in anticipation of the next U.S. Presidential election in 2020.

As shown on the Monthly chart of the SPX below, price has rallied this month from the “median” of a long-term regression channel (which begins at the lows of 2009), and has broken out to all-time highs (above an almost two-year consolidation/congestion level) since Donald Trump was elected as President on December 8th.

(more…)

Real Estate Rally Opportunity

By -

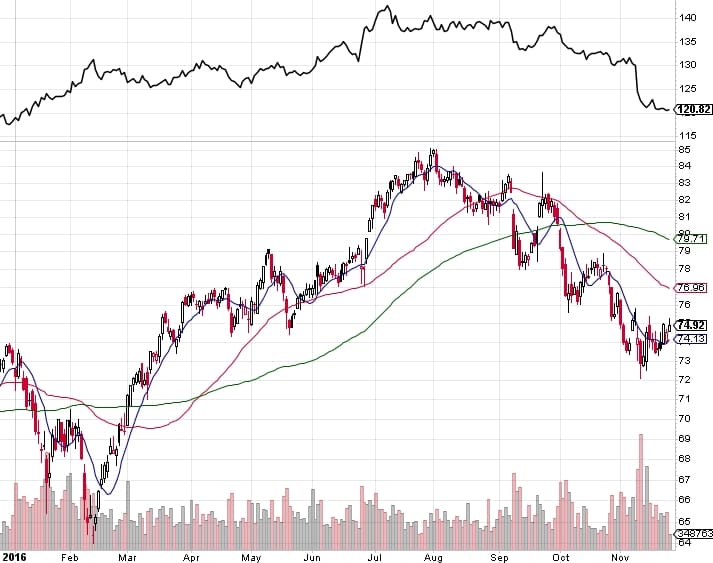
The movement in the bond market has been throwing a few sectors around in the past few months. Today, I would like to highlight the ishares real estate ETF, IYR. You don’t have to look all that closely to see the tight correlation its had to the bond market (represented by TLT) over the past eight months. Keep an eye on that one. As goes TLT, so goes IYR.

161126 - IYR TLT correlation

(more…)

US Dollar Ripple Effect

By -

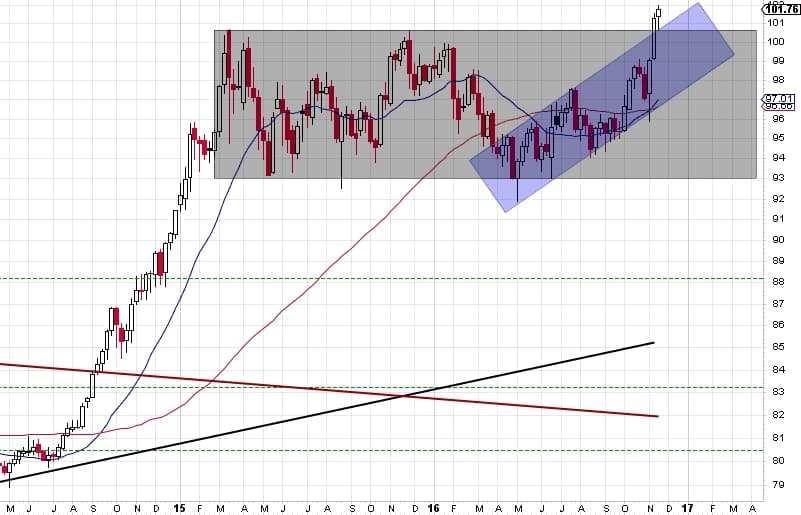
There’s been a number of significant level breaks/hits over the past week and it seems timely for a longer-term chart review. Here come the weekly charts.

A lot of the charts coming up relate in some way to the US dollar so let’s take a look at that one first.

The USD chart has broken out strongly from a 2 year range. There’s no arguing with this breakout, the USD is going higher. Since a lot of commodity charts react to moves in the greenback, let’s take a look at some of the more popular ones.

161125 - US dollar weekly

(more…)