
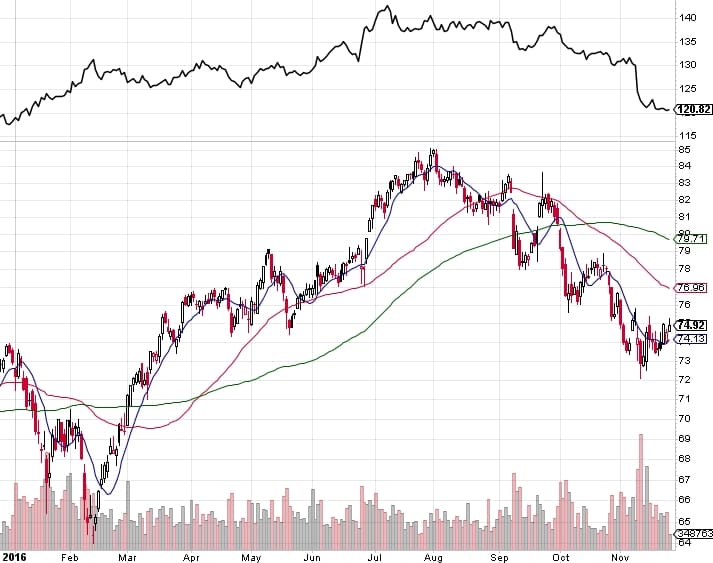
The movement in the bond market has been throwing a few sectors around in the past few months. Today, I would like to highlight the ishares real estate ETF, IYR. You don’t have to look all that closely to see the tight correlation its had to the bond market (represented by TLT) over the past eight months. Keep an eye on that one. As goes TLT, so goes IYR.
Before I get to that though, let’s walk through XHB, the home builders ETF.
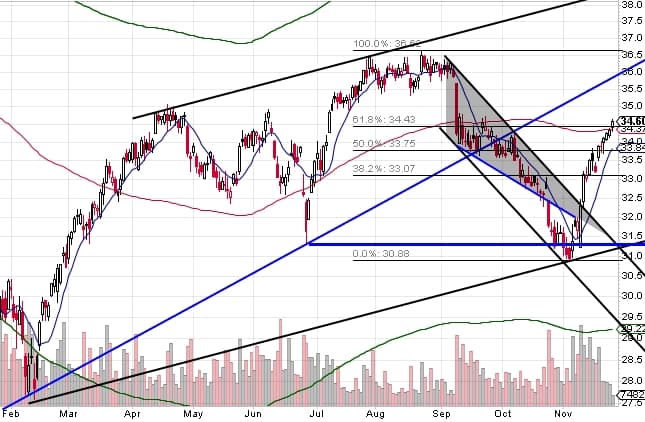
In mid-October I noticed a falling wedge forming on this issue. I bought in anticipation at the lower support line to position myself for a quick rally. However, it soon broke down and I got stopped out. It continued down until it mirrored the unbroken side of the wedge to form a channel (which happens virtually every time from my observations). It hit the 31.5 low from June 2016 along with the channel bottom, put in a low, based, and launched into a large, fast rally.
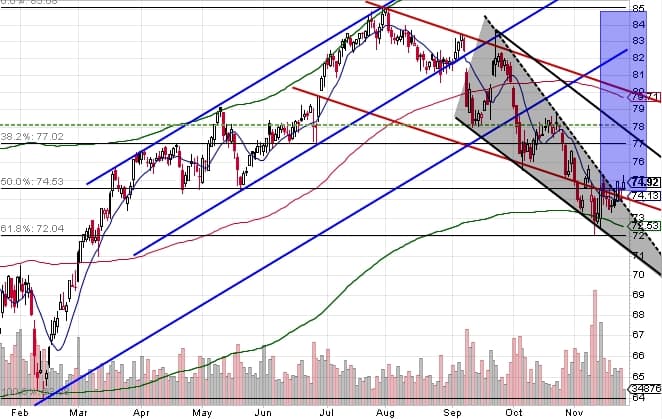
Now take a look at the current setup on IYR. Clearly, we’re seeing another falling wedge, but this one has already broken out, overthrew its downtrend channel (parallel red lines starting in August) which is often a sign of trend exhaustion, and has also stalled its downtrend at support in that it has reached its typical 9% deviation from the daily 100MA. Is it a guarantee? Of course not, but it is a NICE SETUP.
Is there anything I can I learn about how XHB traded and its wedge outcome vs IYR and its current wedge breakout? This is where multiple timeframe analysis can come in handy.
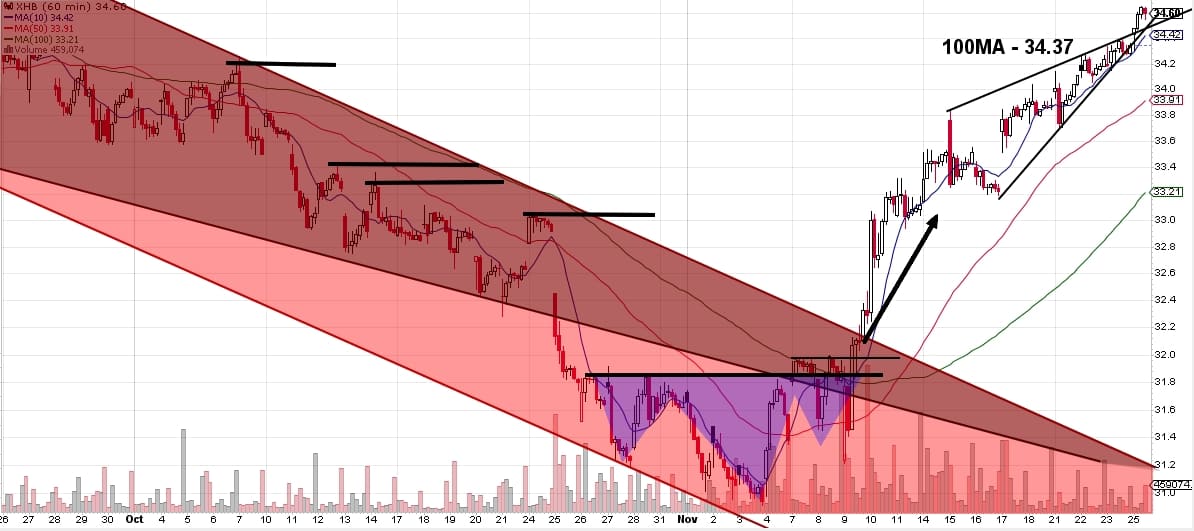
By zooming into the hourly chart, it’s easier to see that when I bought XHB Oct 18th (closed the 19th as my stop was the 32.75 low), it had not made an equal hourly high yet and never did. XHB proceeded to break the wedge low and continue quite a bit lower yet. When it did finally rally to a previous hourly high on Nov 4th, all it took was a little break over that resistance and XHB rallied like a rocket.
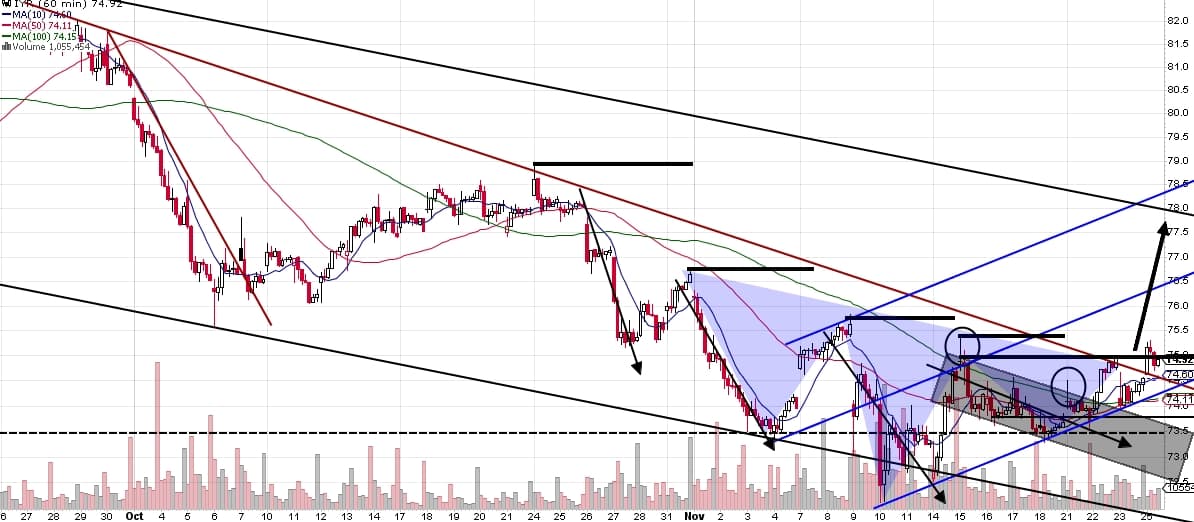
Now to take a look at the IYR hourly, the hourly high has already been breached and this past Friday, IYR broke its falling wedge resistance line. $75 has been stiff resistance, but once it cracks, I think the channel mirror should kick it up to $78 easy.
So to break it down:
Assuming immediate entry and a stop at $74 (requiring a break of the current uptrend line).
Risk: $1.00
Reward: $3.00
