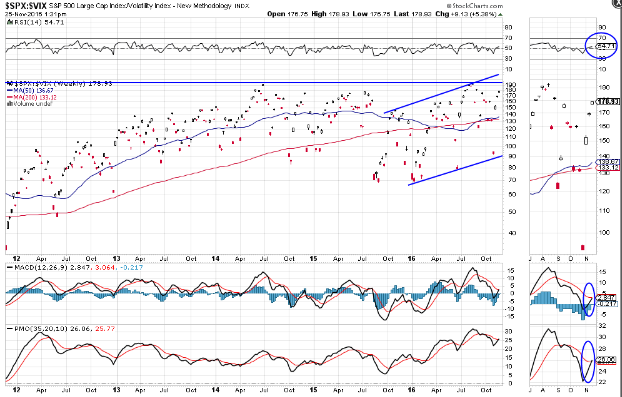
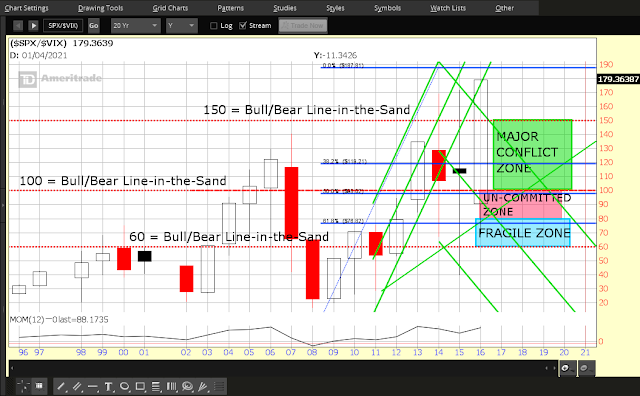
 I’ve written about the SPX:VIX ratio many times in the past. I’ve mentioned, as recently as November 13th, that it will be necessary for the bulls to hold price on this ratio above the 150 level in order for SPX equities to continue their rally with little volatility to impede this rise.
This post will take a look at one possible scenario that could see the SPX reaching a price of 2700, or so, by 2019, in anticipation of the next U.S. Presidential election in 2020.
As shown on the Monthly chart of the SPX below, price has rallied this month from the “median” of a long-term regression channel (which begins at the lows of 2009), and has broken out to all-time highs (above an almost two-year consolidation/congestion level) since Donald Trump was elected as President on December 8th.
It looks poised to continue this advance in a manner similar to that which occurred after Barack Obama was re-elected in November of 2012. If it did continue on that trajectory and at that velocity, we could see price reach the “+2 standard deviation level” on this channel at 2700 by November-December 2018. After such an advance, price could very pull back to around the “-1 standard deviation level” to around 2370, then bounce back to 2700 by the next election in November 2020.
Of course, that hypothetical scenario would depend on a lot of factors — especially whether President-elect Trump’s ambitious economic/tax/fiscal agenda can be supported by Congress and implemented, together with whatever future monetary policy measures may be enacted of the Fed — to merit such an exuberant advance in equities.
 |
|
Monthly SPX |
As can be noted on the following Daily, Weekly, and Yearly (each candle represents a period of one year) ratio charts of SPX:VIX, it will be critical that bulls hold price above the 150 level, which is defined as a major support level, not only by price action, but also by the daily and weekly 50 and 200 moving averages.
The RSI, MACD and PMO indicators are hinting of further short-term strength in the SPX on the Daily timeframe, and crossovers are either imminent or have just occurred on the MACD and PMO on the Weekly timeframe, with an RSI holding above 50, also hinting of medium-term strength.
Price action on the Yearly timeframe is, currently, extremely bullish for the SPX (a massive bullish engulfing candle is forming), and, depending on its close at the end of this year, it may forecast whether the hypothetical longer-term scenario that I’ve described above is realistic and has begun.
 |
|
Daily SPX:VIX Ratio |
 |
|
Weekly SPX:VIX Ratio |
 |
|
Yearly SPX:VIX Ratio |
CONCLUSIONS
We’ll see whether a Santa rally is currently in play…or whether a lump of coal surprises the markets this year. These charts are worth monitoring as part of your crystal ball-gazing activities — in the short, medium and longer terms — leading up to the next Presidential election.

