
I have two scenarios on AAPL here, and given the size of AAPL the way that goes is very important for the wider market. On the bullish scenario the H&S target in the 590-600 area set up a test of the 200 DMA before the next move up. AAPL tested the 200 DMA at 587 yesterday so the downside target on that scenario has now been met.
On the bearish scenario AAPL keeps falling into the 567.5 area, reversing there at a possible H&S neckline before a bounce into the 610-20 area lasting a couple of weeks. On the next neckline break below 567.5 the target would be in the 430 area, but the real target would be long term trendline support slightly over 400.
Either way I would be expecting either a strong bounce here, or $20 or so lower, and the first candidate low has now been reached:

I was looking at three possible IHSes forming yesterday morning, and two of those survived the day. The one that didn't survive was on NQ. No new low was made but the right shoulder went too low. Short term resistance in the 2673 area is well established however and an hourly close above there would look bullish at least into the 2700 area at declining channel resistance:

The ES IHS survived the day, though it's a complex IHS and isn't particularly pleasing to the eye. The left shoulder and head each had two lows so an ideal setup on the right shoulder would be a bounce into the 1410-12 area, a reversal back to test 1400 support, then a move back to the sloping neckline in the 1420 area:

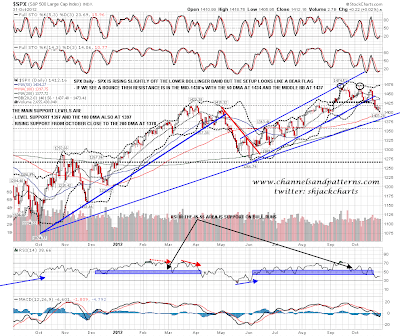
What's worth noting there though is that on the SPX daily chart the last four days very much have the look of a bear flag. That's good in the sense that a break back over the neckline in the 1420 ES area would be a clear break above that flag, but until then there is a target below at rising support from October 2011 in the 1380 area that may be reached on a break below 1400:
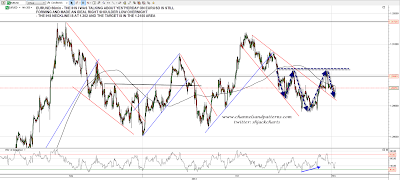
The IHS that looks best of the three that I was looking at yesterday morning is on EURUSD. On a break over 1.302 the target is in the 1.3155 area:
I was talking in my weekend post about the possibility that there would not be a QE bull move as we saw in QE1 and QE2. The dividing line on SPX for me is rising support from the October low in the 1380 area, with the 200 DMA slightly below at 1378. Even a test of that level would limit an upside move from there as it would establish the lower trendline of a rising wedge from the 2011 low. If we are to see a test of the 2007 highs next year then the low for this move is in or very close. If we see a test of wedge support that would most likely limit any subsequent bull move to the 1500 area. If we see a break below 1380 and the 200 DMA then the post-QE3 spike may well have been a major high. As with AAPL this is an important point of decision on SPX.
