Slope of Hope Blog Posts

Slope initially began as a blog, so this is where most of the website’s content resides. Here we have tens of thousands of posts dating back over a decade. These are listed in reverse chronological order. Click on any category icon below to see posts tagged with that particular subject, or click on a word in the category cloud on the right side of the screen for more specific choices.

Major Nvidia Top Looming

By -

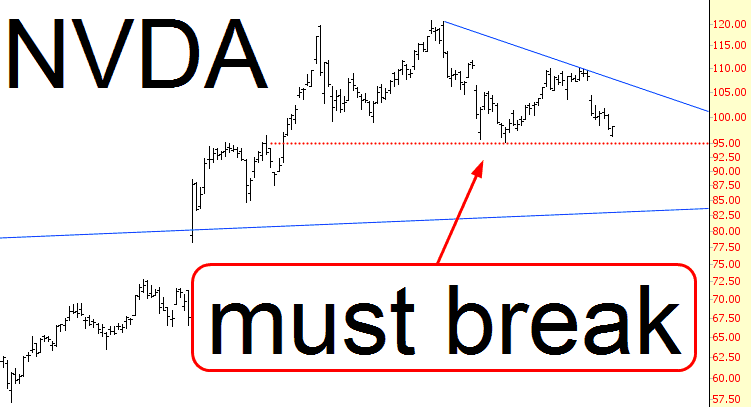
Back on February 10th, I wrote Green with NVidia, which, contrary to every analyst on the planet, said to short it. It turns out that wasn’t close to the top – it WAS the top – for all human history. So thank yew, thank yew very much. In the two months since, it has fallen about 20%, but I think an even bigger top is close to being complete. All this nonsense about a maker of gaming graphics cards becoming a giant in the world of AI………whatEVER.

0411-nvda

Snowy Morning

By -

Happy Tuesday, everyone, and greetings from Northstar, where we own a place for some occasional relaxation. The other members of Team Knight are sleeping right now, as they should be, and your intrepid blogger is in the dark family room, looking out upon the snow-covered pines and light grey fog of a Sierra morning.

It’s a good morning so far, with yesterday’s Slope Plus idea bearing fruit already, and my shorts in general behaving themselves properly (e.g. moving lower, and nothing getting stopped out). My fixation these days, as you’ve guessed, is the Japanese Yen, but I’m just as interested in what crude oil is doing, since it is at a Holy-Lord-this-is-key critical juncture.

0411-crude

I’m going to make a little breakfast and come back to my tiny trader’s workstation (just 2 laptops instead of my normal 7 screens) in a bit.

Failing At Resistance So Far

By -

This week is a holiday week and these often lean bullish but the historical stats for this week are neutral. I’d note though that the historical stats for next week are bullish.

There’s been some impressively tedious tape on Friday and today so far and on the hourly charts all three of SPX, NDX and RUT have been testing their 50 hour moving averages as resistance and failing to sustain any breaks over them.

On the daily chart the picture is more mixed, with SPX and RUT both testing their daily middle bands as resistance, and NDX testing the daily middle band there as support. SPX daily chart:

170410 SPX Daily

(more…)