
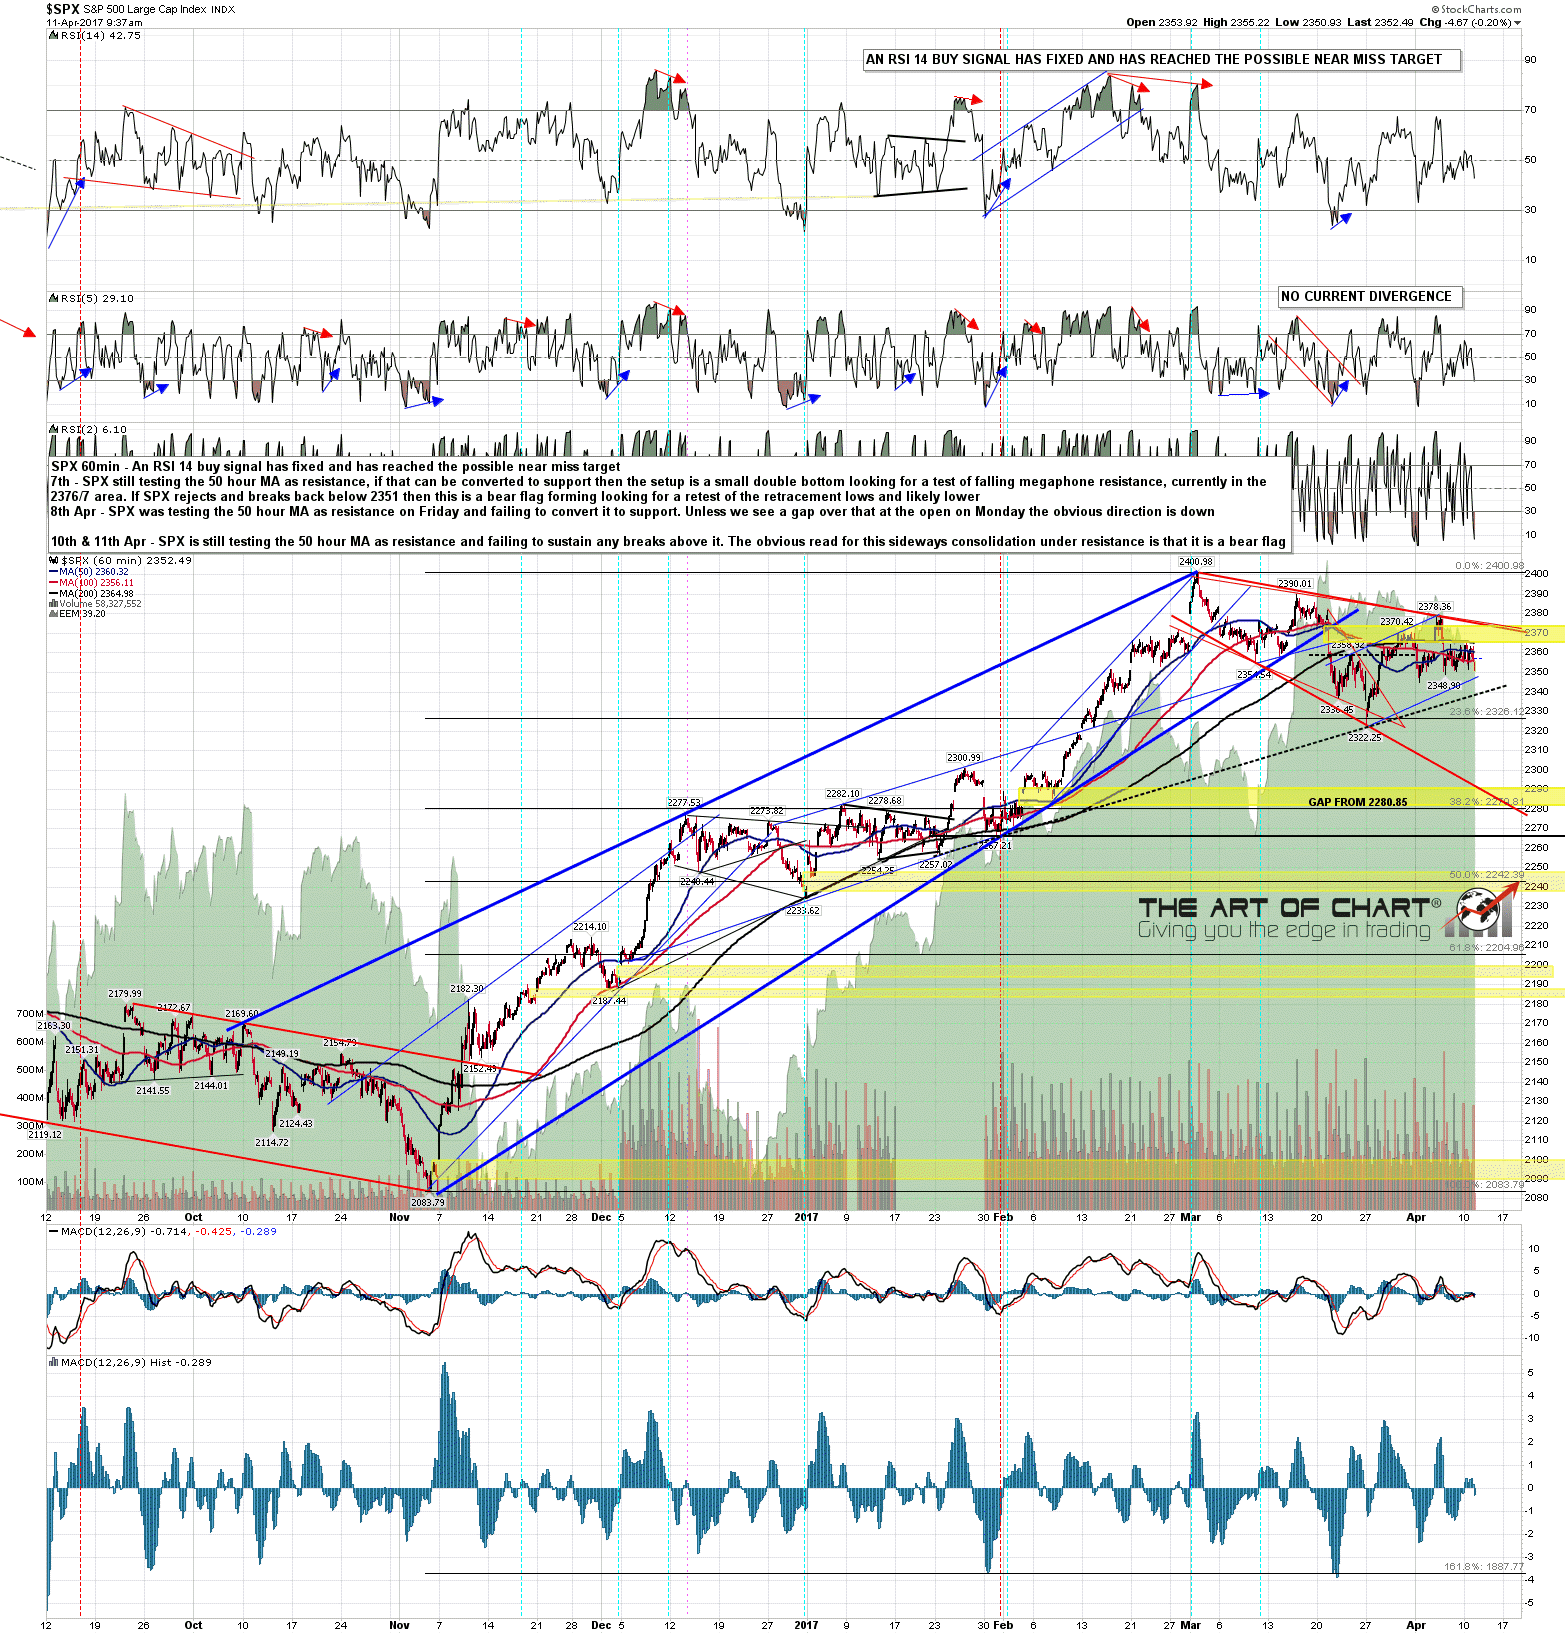
If there’s one thing that has really stood out over the last few months it has been the SPX tape’s tendency to just stop doing anything interesting for several days at a time. SPX has tested the daily middle band as resistance every day for a coma-inducing eight days, but I was saying in my premarket video to Daily Video Service subscribers at theartofchart.net an hour before the open that there was good reason to think that we would see breaks down on equity indices today, and we may well be seeing the start of that now. You can see that premarket video here. SPX daily chart:

On the hourly charts SPX, NDX & RUT were all testing the 50 hour MA all day yesterday and failed to sustain a break above. SPX 60min chart:
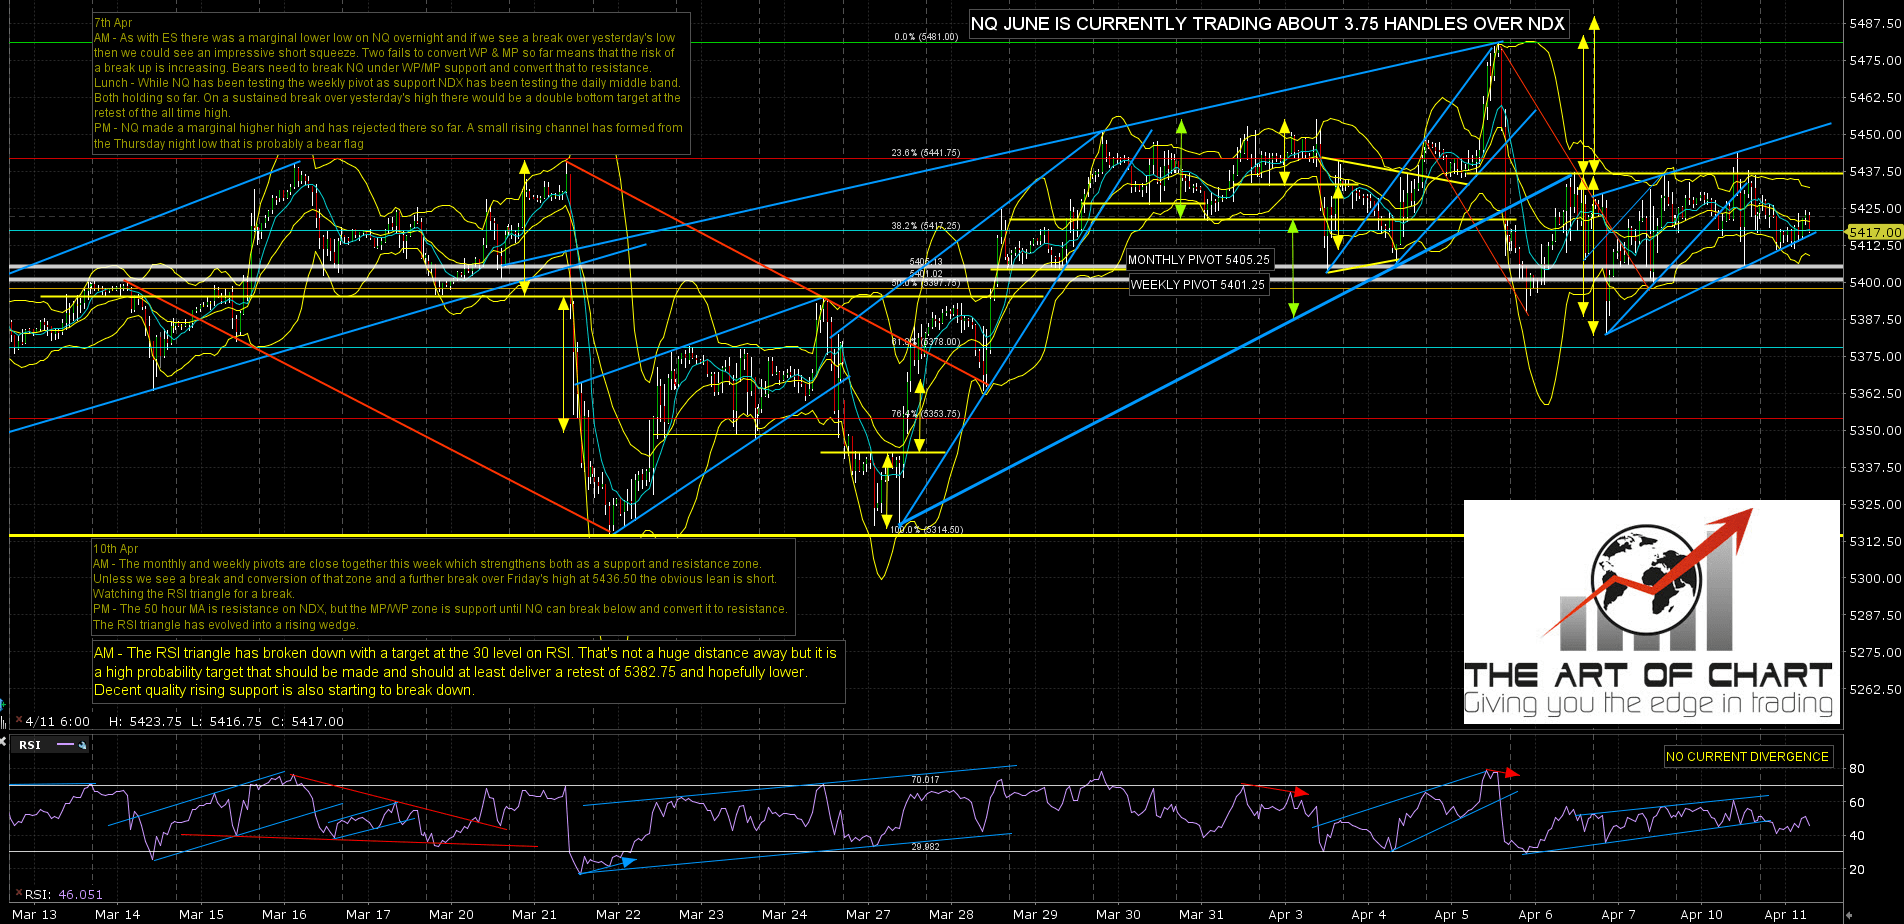
All the futures charts here were done for the video an hour before the open.
What I was looking at on the ES chart this morning was the weekly pivot holding as support last night and the triangle on RSI breaking down with a high probability (80%+) target at 30 on RSI. That has not yet made target at the time of writing and I’m expect it to deliver at least a retest of the recent low at 2336.50. That’s as far as this setup will take ES so any further downside the bears will have to deliver on their own. ES Jun 60min chart:

The setup on NQ was very similar, but unlike ES NQ has already made the targets both at the retest of the recent low and at the test of the 30 level on RSI. NQ Jun 60min chart:
My concern here is TF, which has been the strongest of the three indices this week and where the RSI megaphone has not yet broken down. TF has found support at 1359.5 so far this morning and rejected there so far. That low has established the possible rising channel on TF that I was talking about in the premarket video, and if we are to see a serious leg down from here, that channel is going to need to be broken. If the channel isn’t broken then the next obvious target within the channel is channel resistance, currently at 1382.50. TF Jun 60min chart:
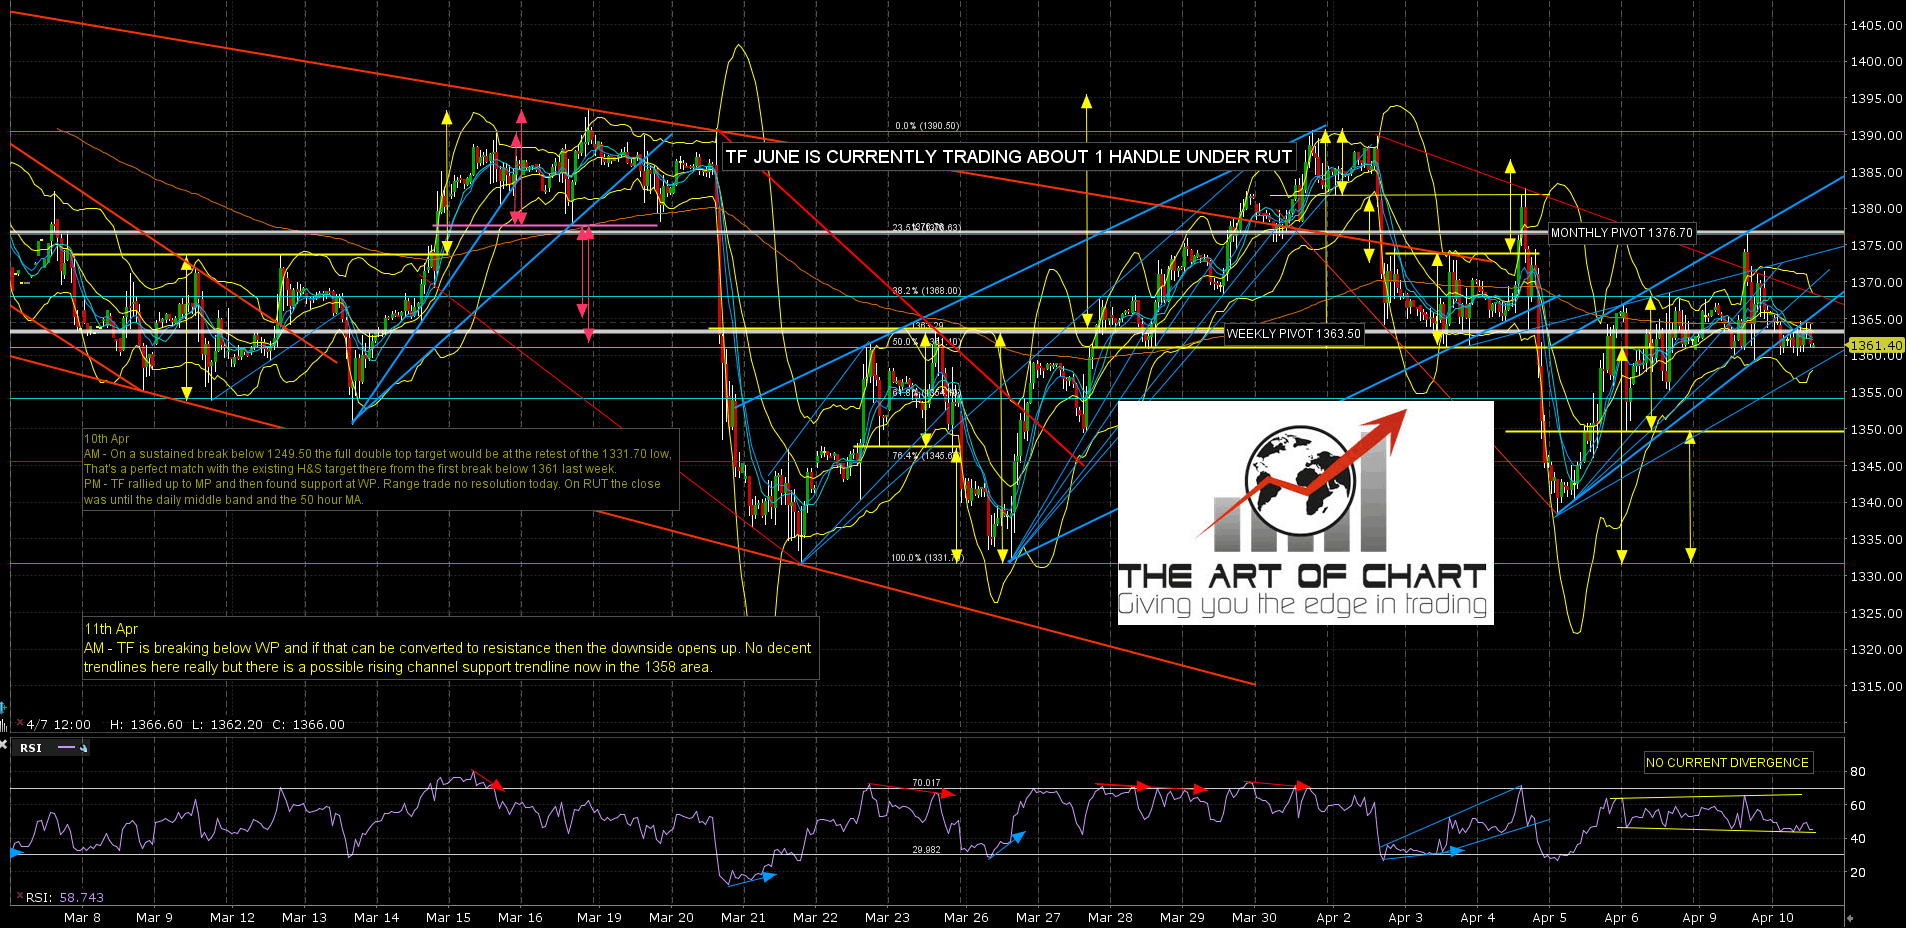
If we are going to see another leg down then the odds favor that starting right here. If this is just a final attempt to break support before the ATH retests that are likely coming within a few weeks in any case, then that TF rising channel likely holds and the next resistance tests may well deliver a break up. Either way we should see the tape start to move which will make a pleasant change.
