I am delighted to let you know of another improvement to our wonderful SlopeCharts product: the Andrews Pitchfork drawn object. (Press Ctrl-F5 to refresh your SlopeCharts page if it’s already up and running).
This drawn object behaves somewhat like a channel drawing tool. After you have chosen the tool, you first click on the start of a trend (below, yellow highlight) then the first extreme (green tint) then the reaction extreme (cyan tint). The trio of trendlines extends from there, as shown below with Home Depot. To be clear, these tinted portions don’t show up; I have simply added them to the chart for illustrative purposes.
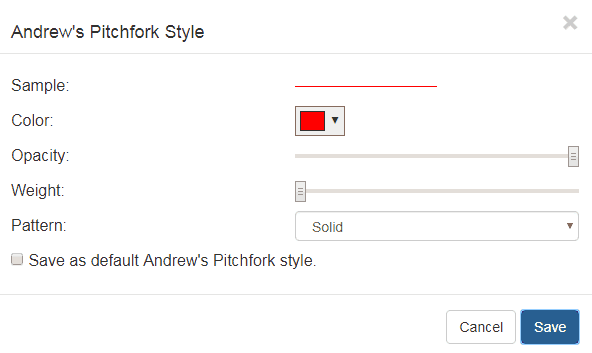
You can right-click any pitchfork to modify its color, opacity, weight, or pattern. As shown in the dialog box below, you can also preserve any settings as your default.
We will continue to add features to both SlopeCharts as well as the Slope site in general. Some of you have asked specifically for the pitchfork, so I’m glad we were able to satisfy this need.


