I am very pleased to let everyone know of a new feature we’ve rolled out (in “alpha” form). You can select it here under the PLUS menu. For a while, I’m going to let everyone have access to it.
Slope of Hope Blog Posts
Slope initially began as a blog, so this is where most of the website’s content resides. Here we have tens of thousands of posts dating back over a decade. These are listed in reverse chronological order. Click on any category icon below to see posts tagged with that particular subject, or click on a word in the category cloud on the right side of the screen for more specific choices.

Falter or Halter?
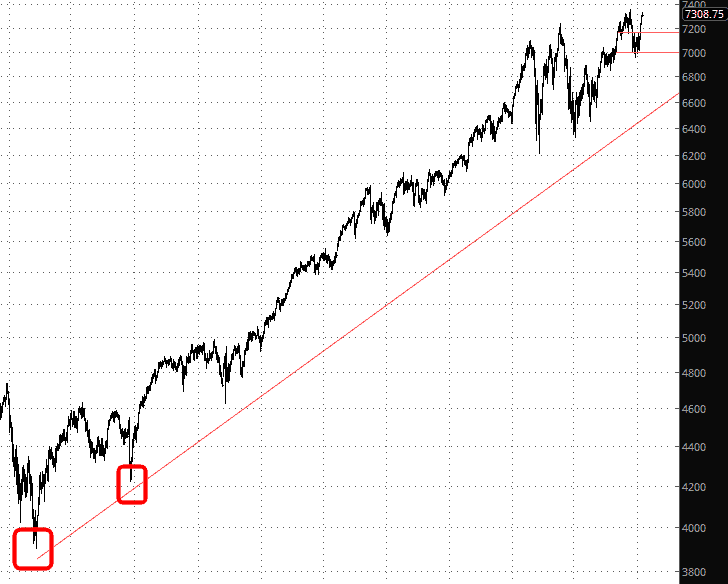
I was briefly looking at some charts on a non-SlopeCharts platform, and a trendline I had drawn looked like the item below. As you can see, now the trendline was magically ripped away from the anchor points. This would NEVER happen on SlopeCharts. So I wanted to take this opportunity to again suggest, nay insist, you give SlopeCharts a try if you haven’t already. It’s free, it’s fantastic, and it’s getting better every week.
Domesticated
I was holding off doing a new post for a while tonight, because we’ve been working on a new page. It isn’t done yet, so I’ll just share a few more charts while I wait for the new page-critter.
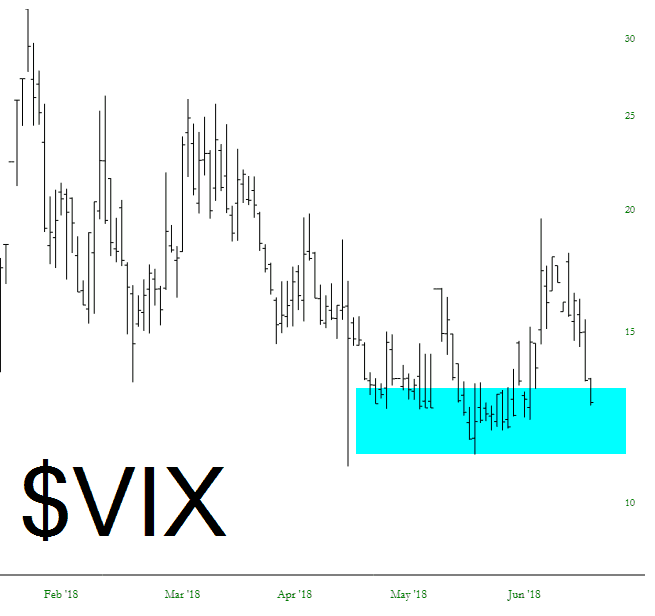
First off, the dashed hope of a rocking bear market which ran so fervently early this year has been smothered to death in its crib. Volatility is, once again, a pathetic joke. We’ve got a sub-teens VIX, which doesn’t happen that frequently (I’ve tinted this sad, sad zone for clarity).
Max Headroom
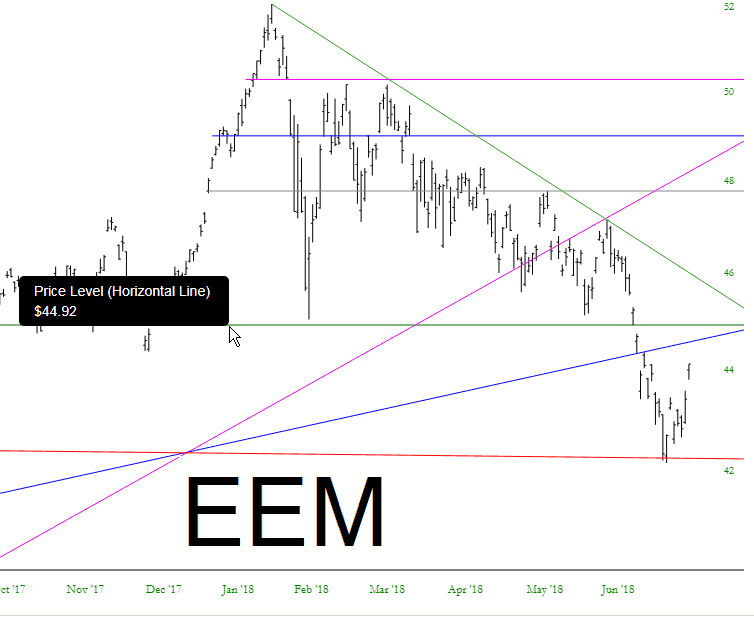
Stocks vaulted higher (once again) today, with many indexes at or very near lifetime highs. There certainly may be gasoline left in this most recent rally, but I wanted to point out some important thresholds in emerging markets that could mark a point of exhaustion, since these markets will be hitting their own lead walls of overhead supply.
First, very broadly, there is the emerging markets. I’ve placed a marker showing where SlopeCharts indicates the point of resistance.
Real Estate Reverses Away from Apex
Pretty interesting, from a charting perspective; check out the symmetric triangle:

