Click here for part one and here for part two.
Understanding Emotions in Charts
What if you could learn to identify emotions in charts? What if you could quantify where key emotional decisions were made, and look to profit from that knowledge? How would you use that information to your advantage? In this article we are going to examine how emotions are visible in charts, as well as how to understand what emotions look like at extremes.
Your emotions will always seek to move back to a place of equilibrium when stretched. Were your emotions wounded? Your emotions will seek a means to heal themselves. Were you moved to place of extreme excitement? Your emotions will seek a means to calm themselves. Were you moved to a place of fear or panic? Your emotions will seek a means of creating safety. How you choose to navigate this process can be by either destructive or healthy means.
To uncover emotions in charts we will be examining points of control, value areas, as well as standard deviations. We will discuss what each level represents, how to construct it practically, as well as how to use it in trading. In the first video below, I will discuss how to create and use a monthly point of control, as well as a value area.
Why can POC’s be considered to be a price level of intense emotion? This was the price level that had the most trading volume during the month. This was the level were decisions were made. As we have seen in Part 1 of this series, it is impossible to make a decision without engaging your emotions. Therefore, I would argue that the POC not only represents a key decision level, but also a key emotional level.
Understanding this concept will help you to understand how price reacts around that level in the future. There were strong emotions seen at this level, and there will likely be strong emotions and decisions made at this level again if price come back into contact with it. If buyers were seen initially at this level, there will likely be buyers again at this level in the future. Conversely, if something has changed in the stock you are looking at, it can be seen at this level. If prices falls beneath this level, where key emotion had been shown, fear and strong selling may then accompany this change at the POC.
As we saw in the video, a monthly value area is the range were 70% of the trading volume took place for the month. We can use this information to help instruct our trading in a number of ways.
First, looking to buy at value low and short at value high can be a tool. Next, we discussed in the video the concept of what happens if price is outside of the value area and then breaks back into the value area. In our example, price started out in December above the value area, and then fell back into the area. When this occurs, there is an 80% chance it fall all the way to value low, as it did in December. Finally, breakouts of the value area can also be a profitable trading strategy. As we saw in the video, SPY broke above value high, retraced and found support at that level, and then continued higher.
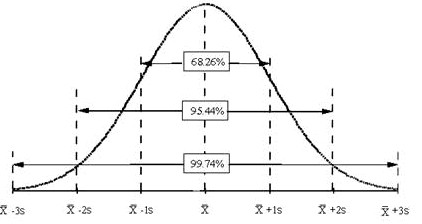
In the next video I will discuss how to create and use monthly standard deviation levels, as well as where fear can be seen in charts.