
Beloved Boeing is said to be too big to fail. For many, many years the stock has blessed its shareholders with rising prices. Recent events and the following charts tell the tale of a now beleaguered Boeing.
Boeing’s outgoing CEO gets $62 million; it’s more than that when Muilenburg’s stock options and money accumulated in his pension and deferred compensation account are added.
The company faces $5.4 million in FAA fines for using faulty parts, their biggest supplier plans to layoff 20% of its work force because of halted production on the 737Max, and the company has earmarked $6.1 billion to pay in compensation over the 737 crashes.
If Boeing raises more debt to cover rising expenditure [as The Wall Street Journal has reported it is considering], it will be the third time they’ve done so since the grounding of the MAX.
Most recently, troubling internal documents were released. One such document quotes one worker to another as saying, “Would you put your family on a MAX simulator trained aircraft? I wouldn’t.” The other employee responded, “No.” That’s but one, of many other damning reports.
Everybody loves a winner and Boeing has been just that in a big way since 1973…doing even better since 2009 and its best since 2016.
Boeing’s Annual chart:
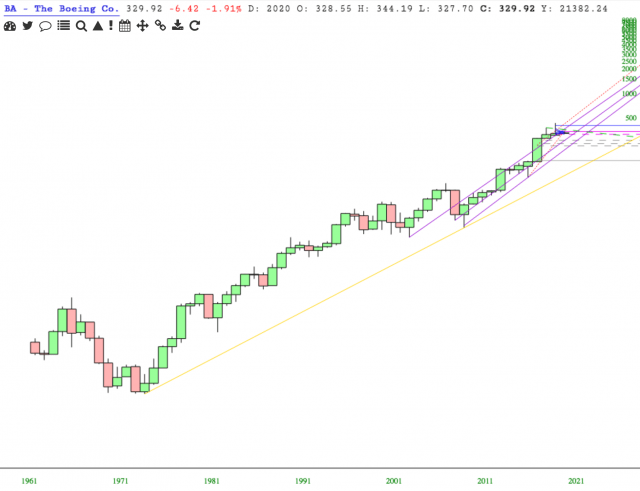
Since March of 2019 the stock price has suffered and the tune has changed.
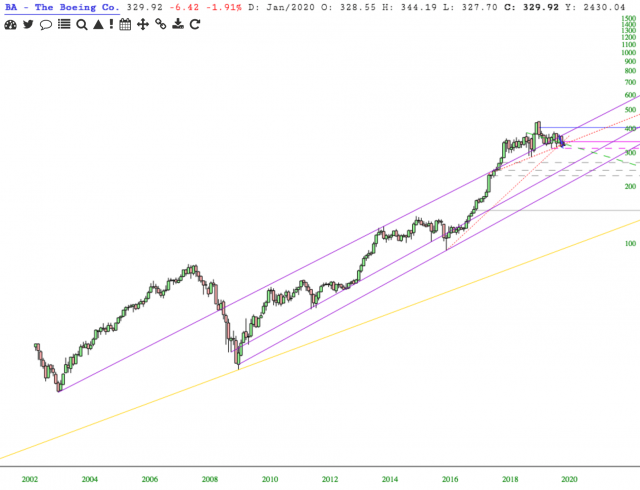
The Monthly chart shows that price lost support of the top purple channel in Dec 2019.
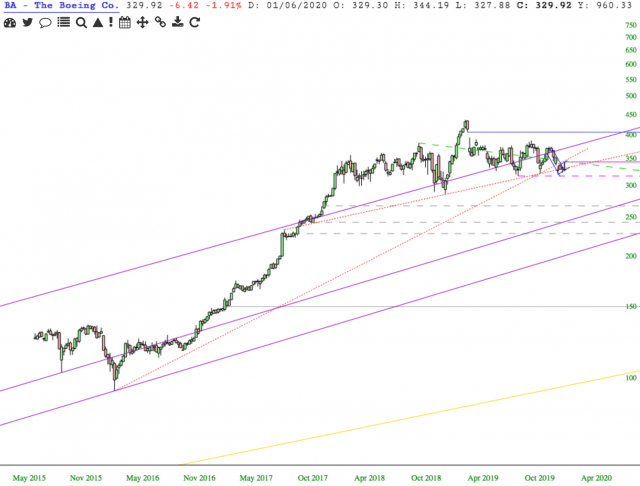
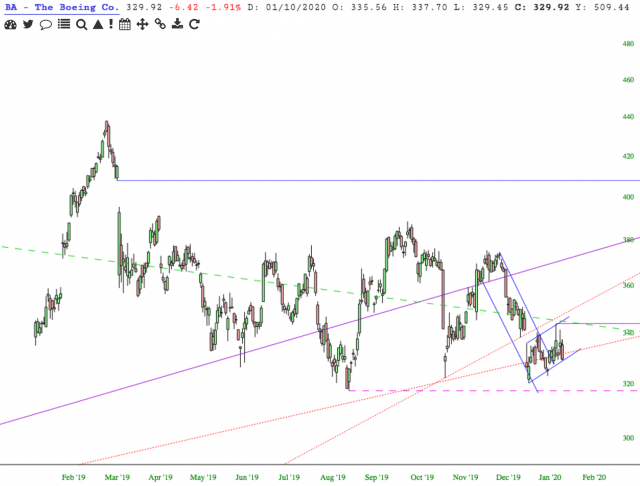
On Boeing’s Weekly chart, note the two red dotted lines and that price has fallen below both.
Of note on the Daily chart is that the ADX black line shows waning strength in the price advance made since the end of December 2019.
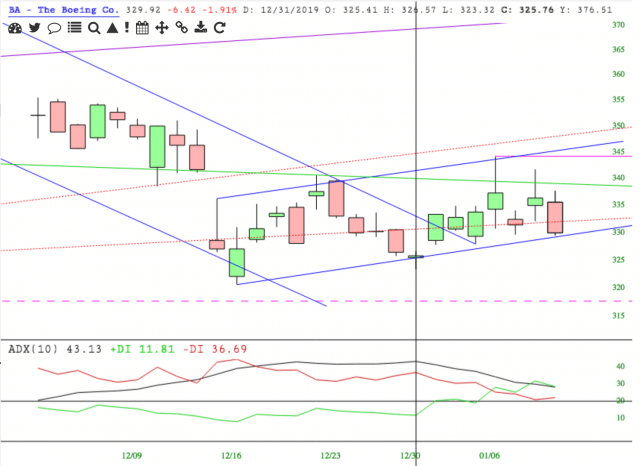
Also on the Daily chart is a bearish flag in the making.
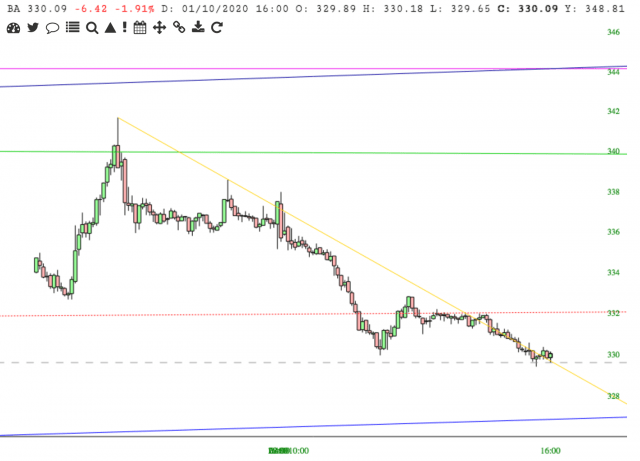
The 5 minute chart suggests price may test resistance around 332.25. IF it fails there, it will likely head back down to support of the [proposed] flag’s bottom blue band.
Right now things look battered and bruised for Boeing. No one knows what will happen next. IF price breaks below the 317.70 support, my next support target is 267.70.
