Yep, it’s another all-green morning. It always seems to be that way these days, although as yesterday proved, that can change quite swiftly. But as we prepare ourselves emotionally, financially, and spiritually for the Powell speech (which, I betcha, is going to be a big nothing-burger with a slice of Kraft cheese inside) I wanted to say a few words about time perspective.
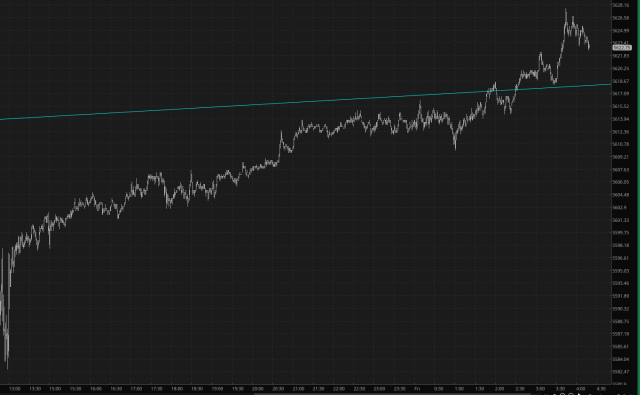
For very short-term traders, the overnight action is their bread and butter. With a short-term time perspective, the /ES has done great, as has just about every other asset class. As the fabled market genius and icon of sartorial splendor Jim Cramer might say, “buy, buy, buy!”

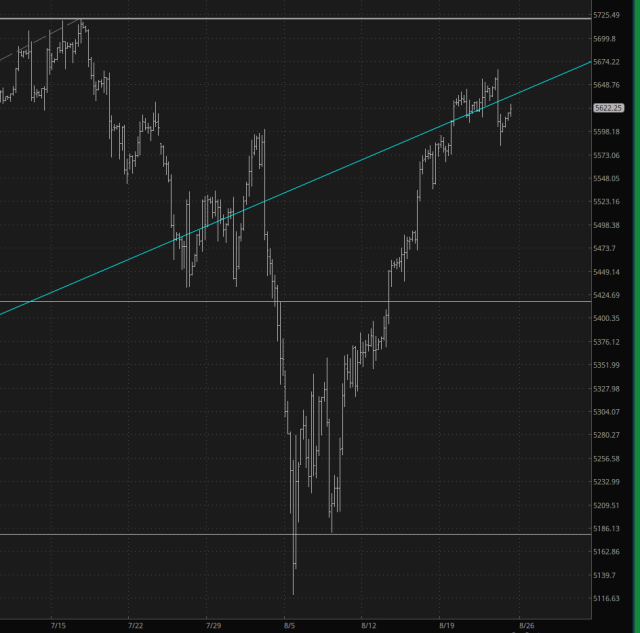
For your humble narrator, such a chart is disconcerting. However, I’m a swing trader, and as such, I have trained myself not to get freaked out, flustered, or nonplussed over such ephemeral wigglings. I’m more interested in a longer-term horizon, such as a daily or a, as below, a 4-hour chart. What I see above is a relentless bid. What I see below is the failure to match a prior high, the multiple failures of a major trendline, and a market which has had a massive and historic counter-trend rally that bears all the hallmarks of being exhausted.

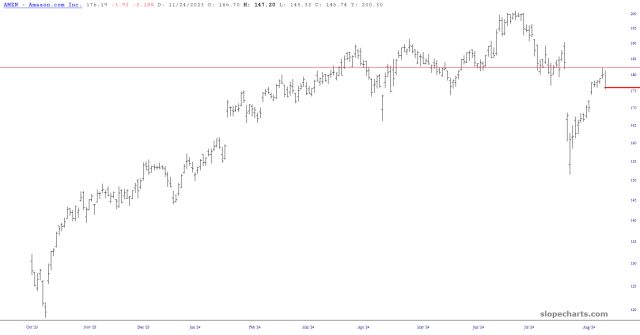
The same holds true on a daily chart basis. I can examine any of my twelve present positions and explain why the potency of the bearish argument is so much stronger than any fitful counter-trend thrust the bulls, egged on by the king of all permabulls, Jerome Powell, might want to muster.

To me, being able to respect the charts is existential to the entire field of technical analysis. If these longer-term charts are meaningless, truly what is even the point? It means the lies win. I trust the truth more than the lies however, and from my perspective, all that can be known is already integrated into the data represented in front of our eyes. All we have to do is hang on tight during the short-term gales and keep our eyes affixed on the more important long-term horizon.

