

I was laying out a possible bearish scenario on SOLUSD (Solana) on Thursday morning. It wasn’t my main scenario but I was saying that on a break under support at 165, it might well deliver. I was planning to write about that in a post this morning as something we would likely see this week. Annoyingly however, I see that my downside target was reached this morning, so I am regretting not writing the post on Saturday. You can see that premarket webinar from Thursday 1st Aug here, and I start talking about crypto at 06.26.
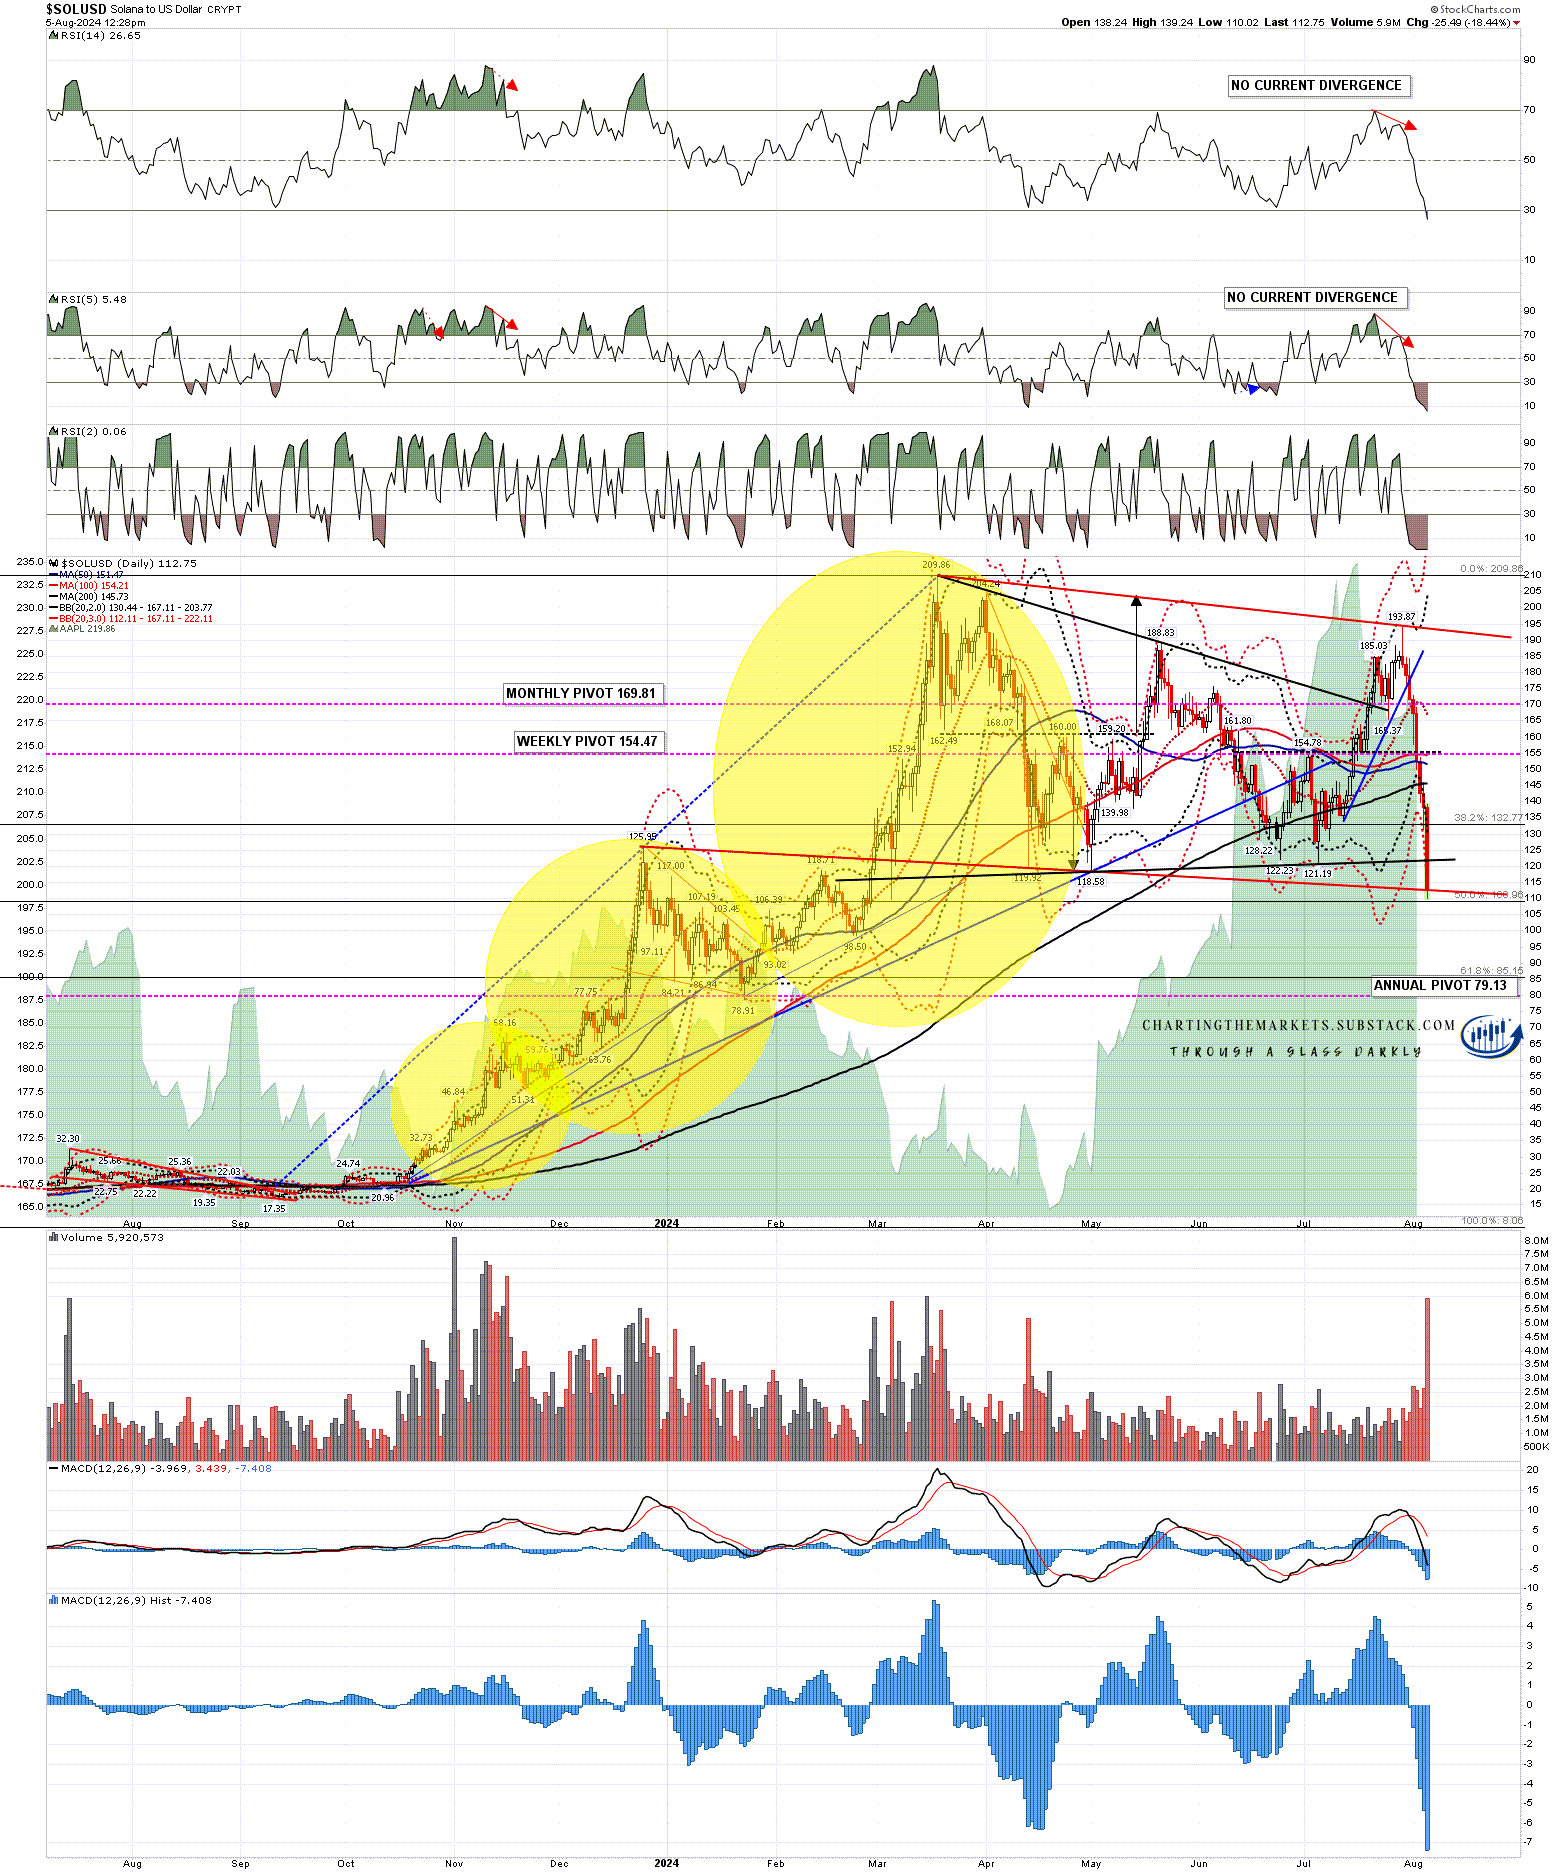
Sometimes a bull flag forms and then evolves into a larger bull flag, and that is likely what has happened here. My friend Matt mentioned to me on 31st July that a guy he watches on twitter, Bluntz_Capital had suggested that SOLUSD might be starting another leg down & asked me to have a look at his scenario. I told him that I thought it could well happen on a break below 165, and that it should form a larger and better bull flag that would take SOL close to the 50% retracement in the 109 area of the move from the late 2022 low at 8.03 to the 2024 high at 209.86.
As you can see on the chart below, that target trendline was hit and slightly broken at the low this morning, so I think a swing low may well be close with a good chance of a move back to retest the 2024 high at 209.86.
SOLUSD daily chart:
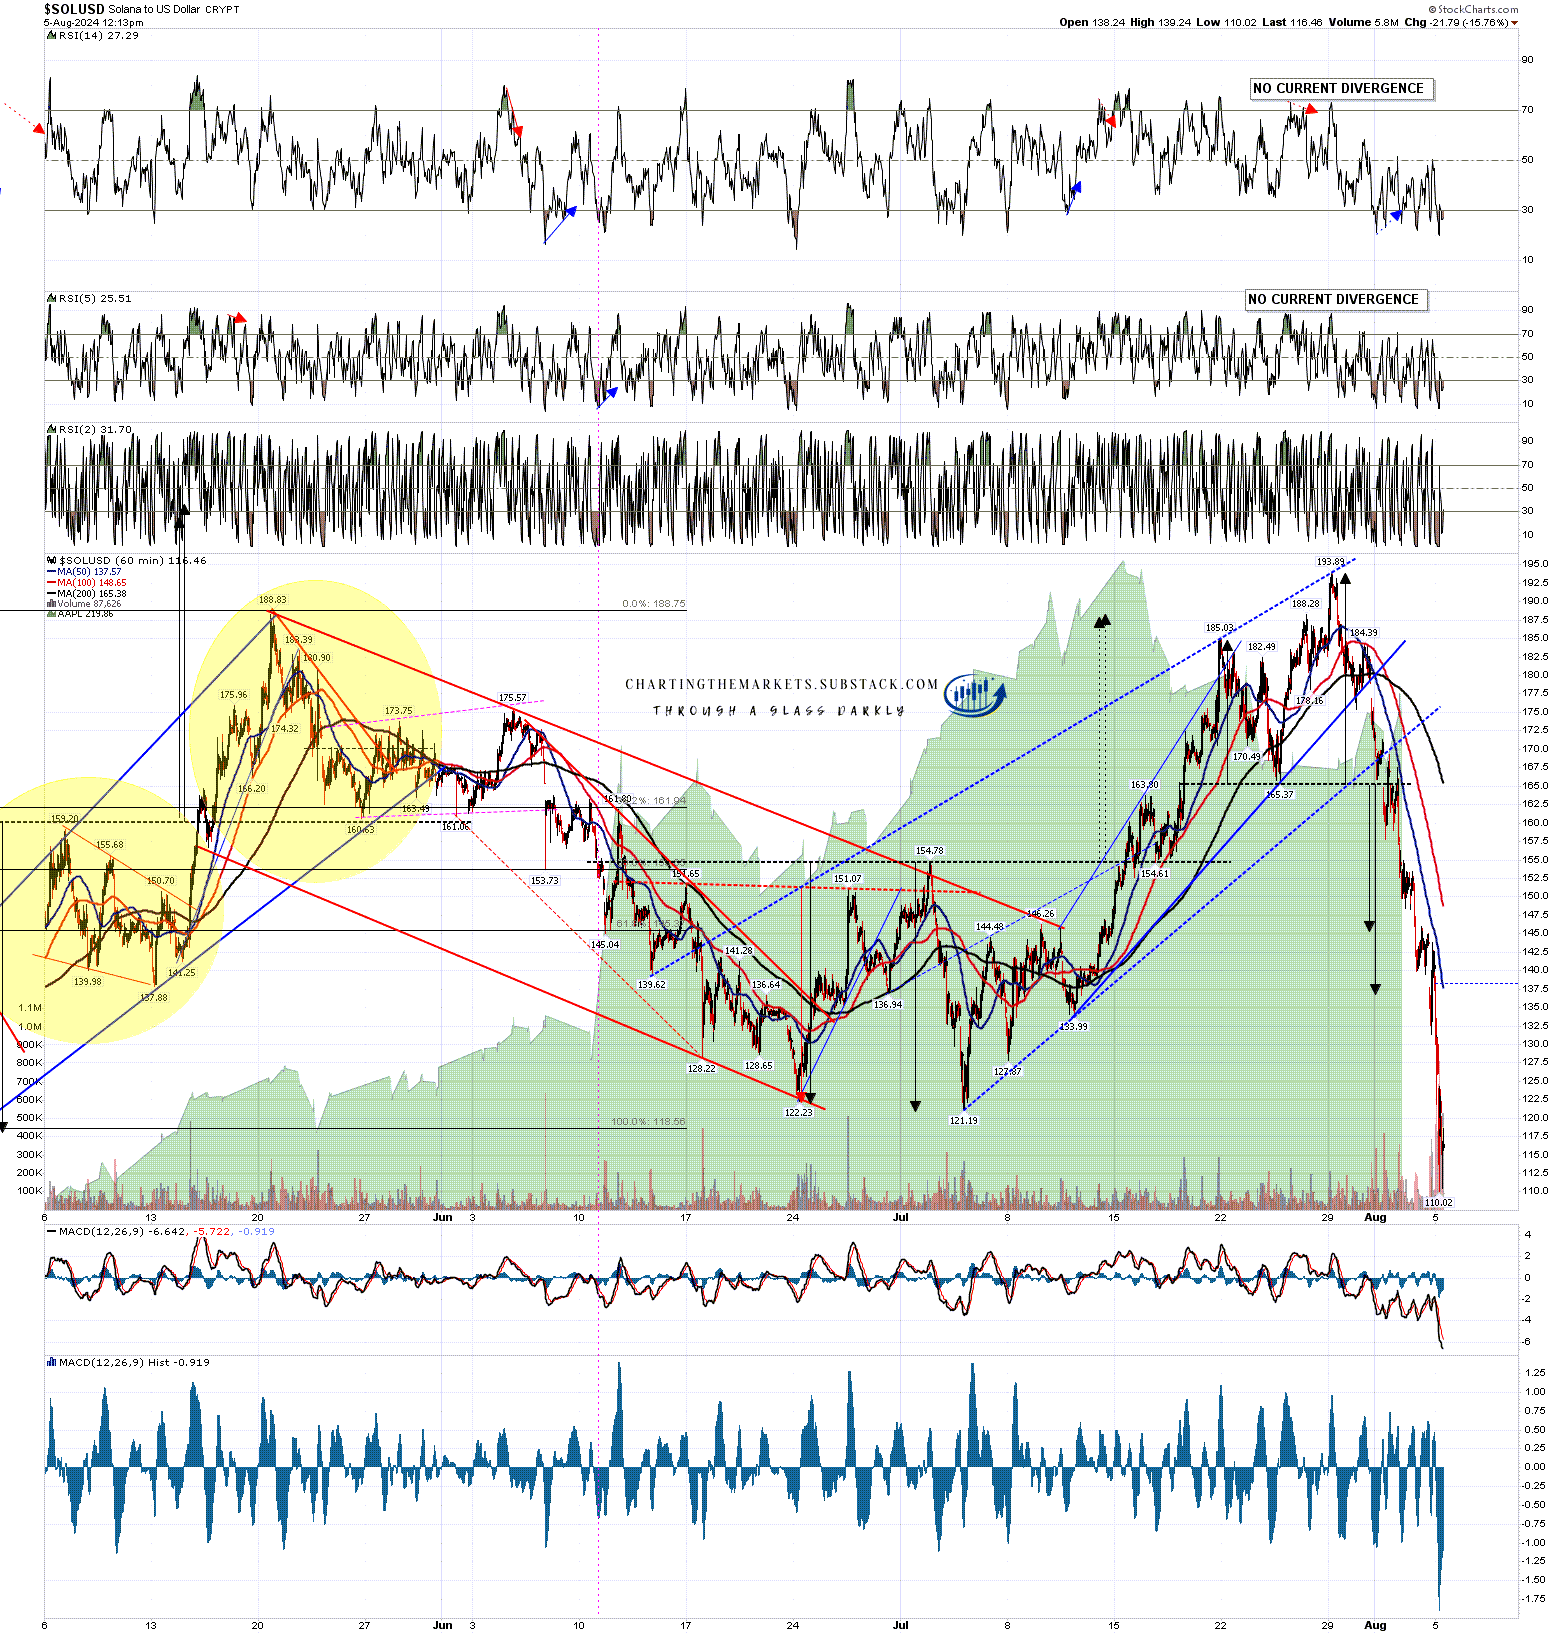
On the Solana hourly chart a retest of the overnight low at 110.02 would set up positive divergence on the hourly RSI 14 and, depending on the strength of the rally first, probably the RSI 5 as well. There are fixed buy signals already on the 15min and 5min charts. With the 3sd daily lower band currently at 111.97 already hit, I am looking for at least a strong rally here.
SOLUSD 60min chart:
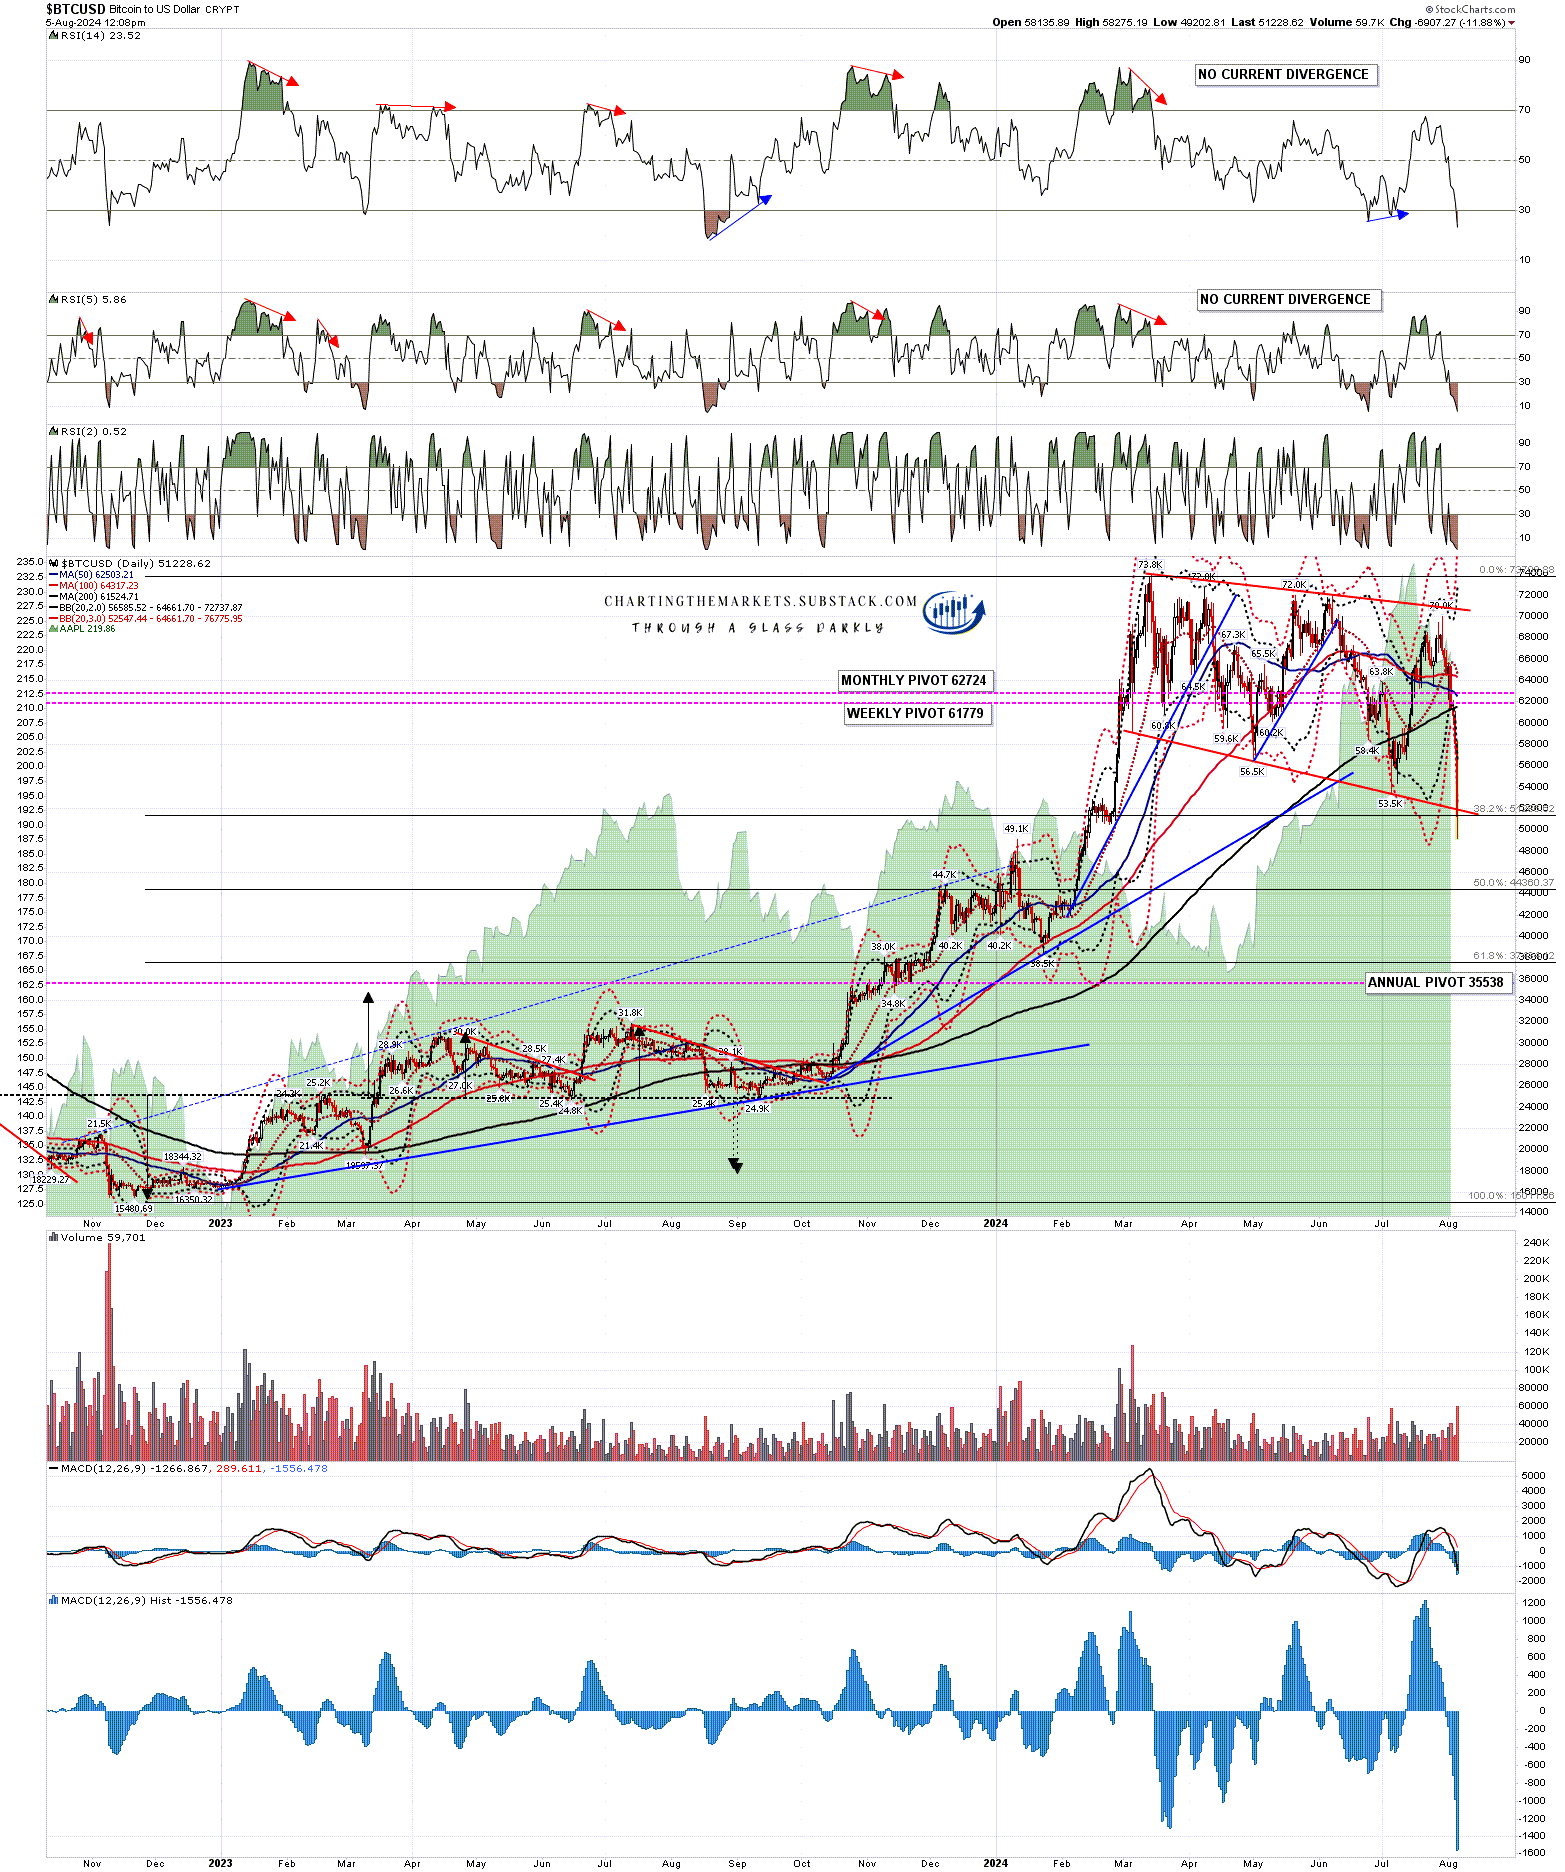
The scenario above wasn’t my preferred scenario though, because it fit less well on both BTCUSD (Bitcoin) and ETHUSD (Ethereum). Bitcoin has now broken below my bull flag support trendline and that is likely a bullish underthrow. Bitcoin has also traded below the daily 3sd lower band this morning and also should be close to at least a strong rally.
BTCUSD daily chart:
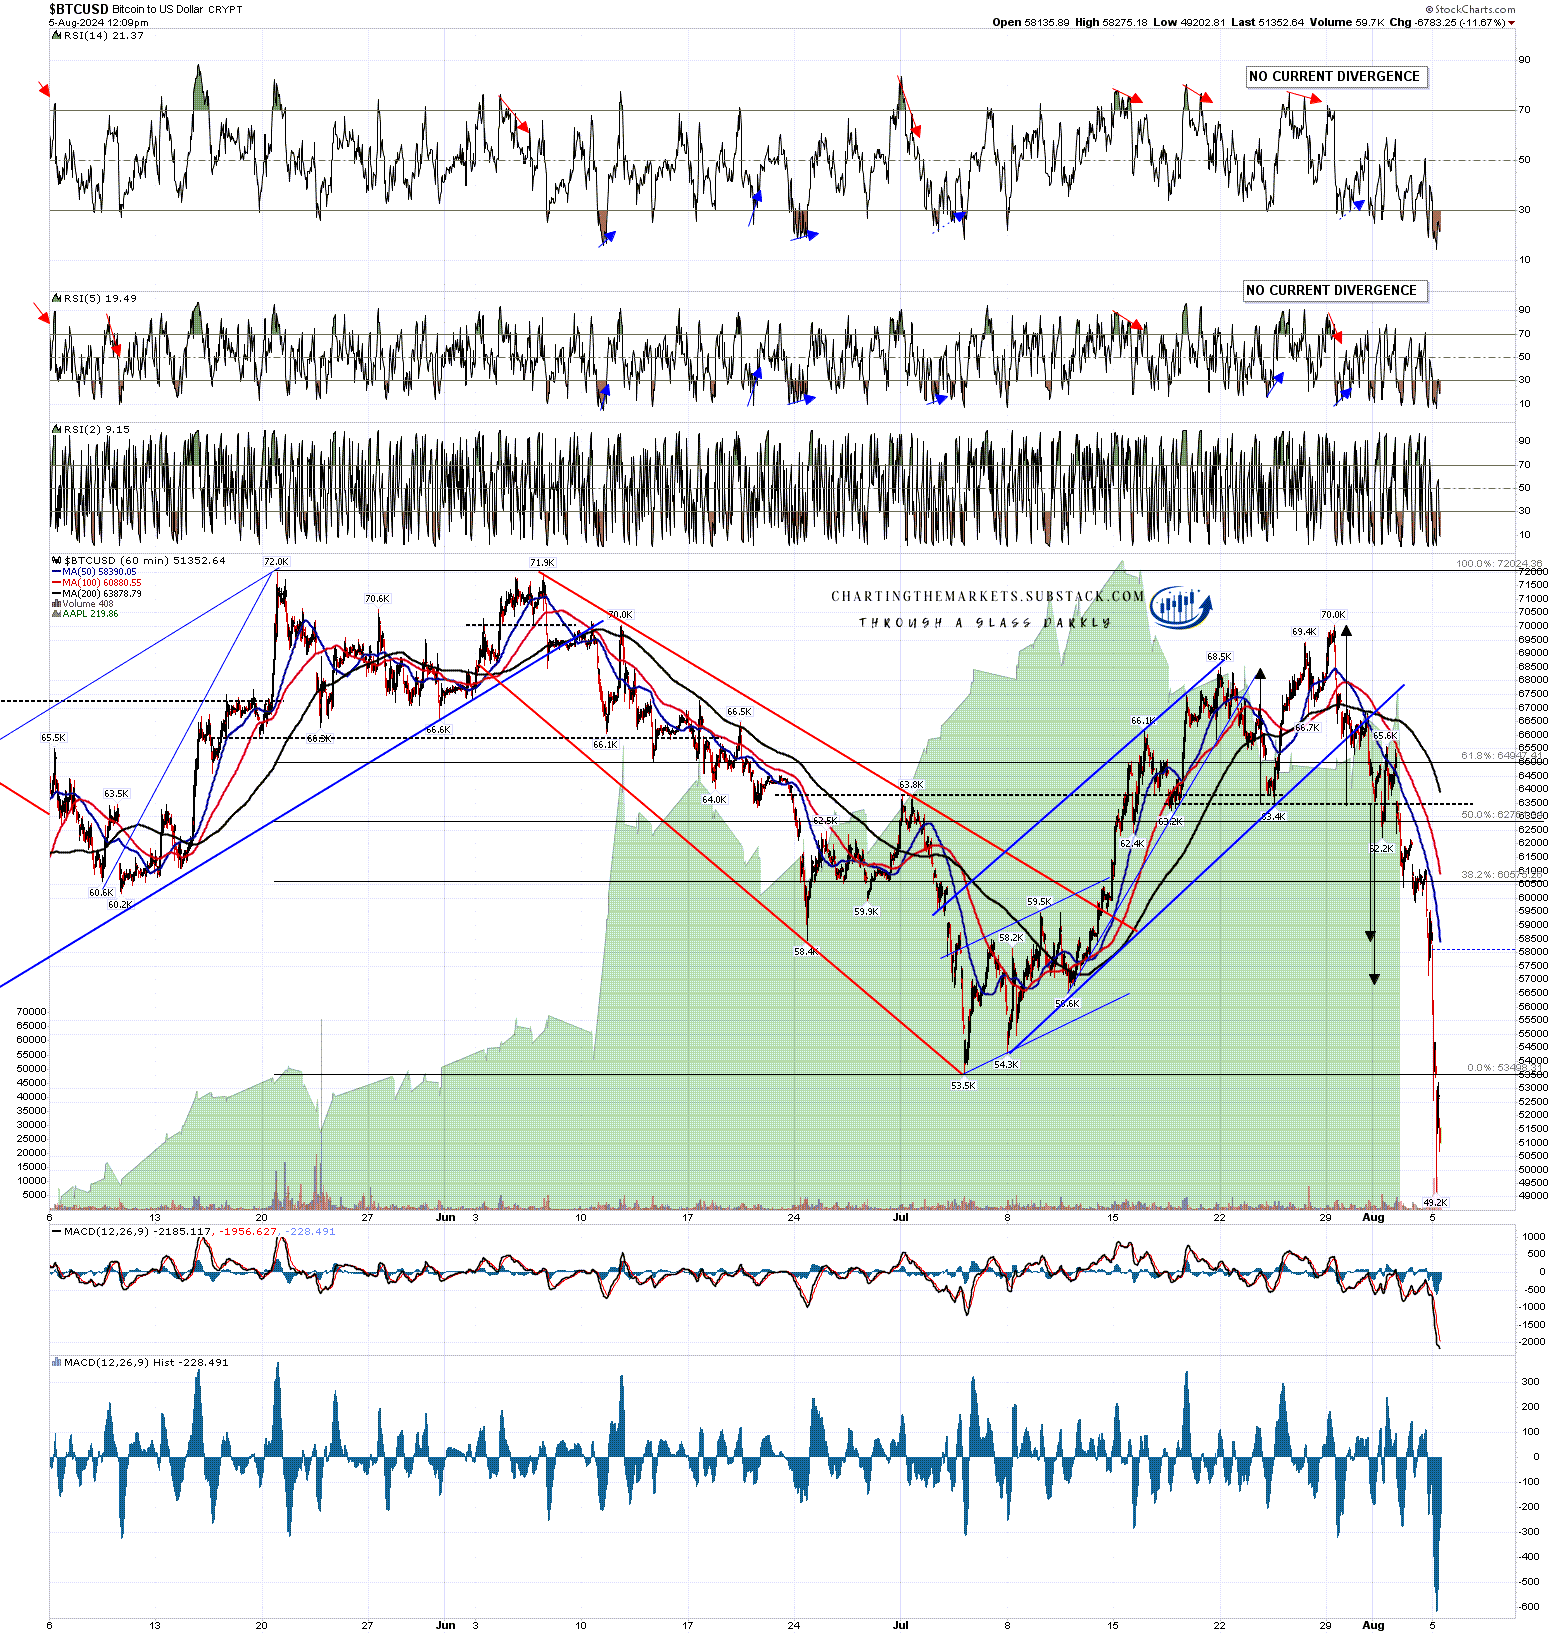
On Bitcoin again, a retest of the overnight low should set up positive divergence on the hourly RSI 14.
BTCUSD 60min chart:
Ethereum has been the weakest overnight, crashing through my triangle support in the 2800 area overnight, breaking below the daily 3sd lower band, now at 2313, and the 61.8% retracement in the 2225 area. Again, at least a strong rally is likely close.
ETHUSD daily chart:
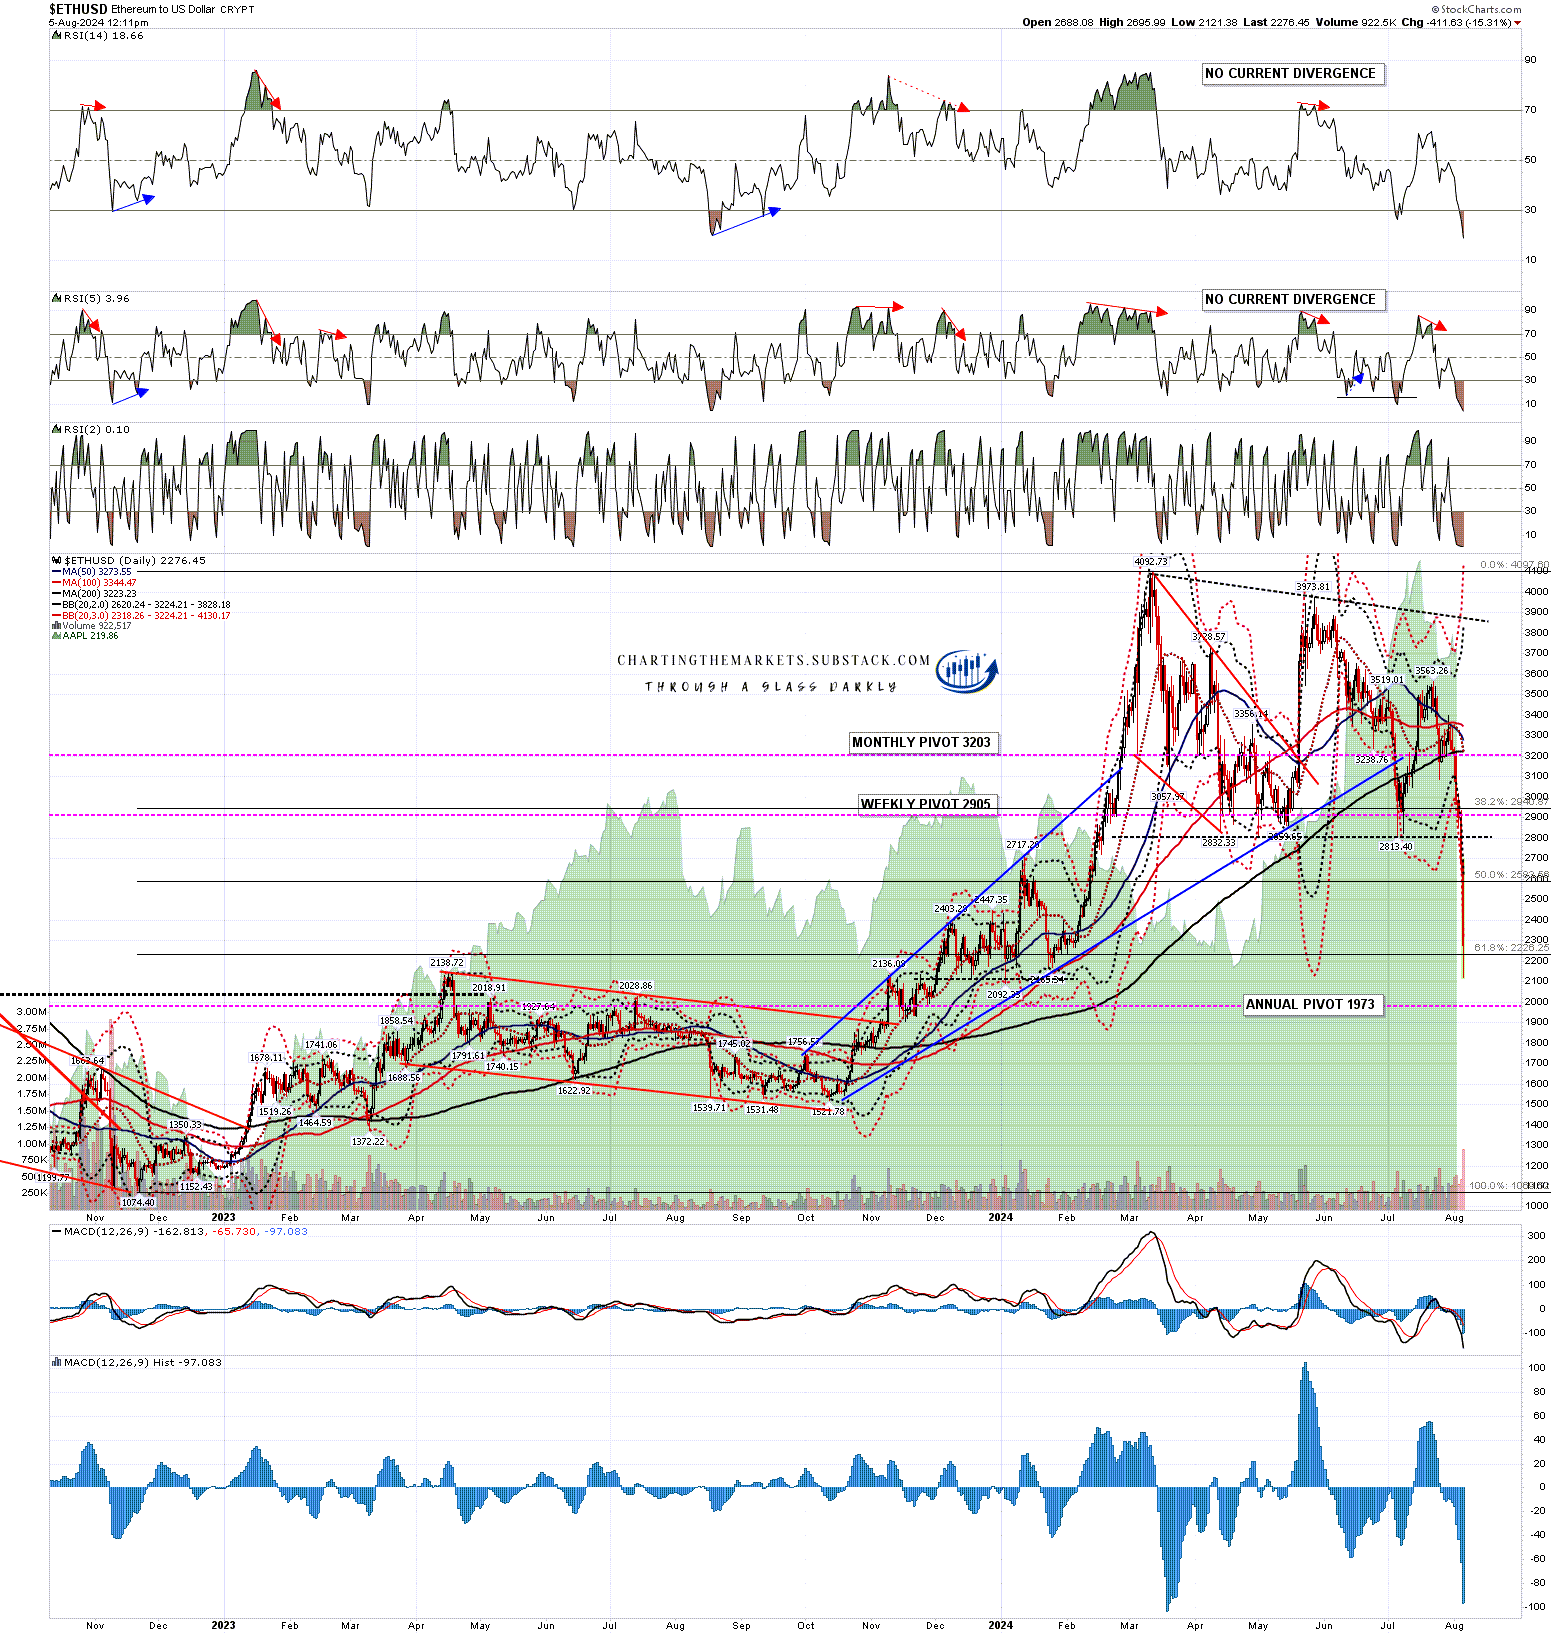
Has the overall bull case been damaged on cryptos? Somewhat yes, but the lean is still strongly for at least a strong rally in the near future and that overall the bull flag scenario here still looks likely. I am uneasy however about the strength of the decline on Ethereum particularly and need to have a close look at the trendline setup when this next low is found.
In other news I am leaving theartofchart.net today, my charting home of the last nine years, and my new website address is at chartingthemarkets.substack.com.
