

My post yesterday was close to the rally high so far and all the bear flags I showed broke down shortly afterwards and continued down the rest of the day.
Now on a break down from a bear flag the target is the retest of the prior low, but there are other options, notably when the flag that has broke down is just the first leg of a larger bear flag that is still forming, so I’ll talk about that today.
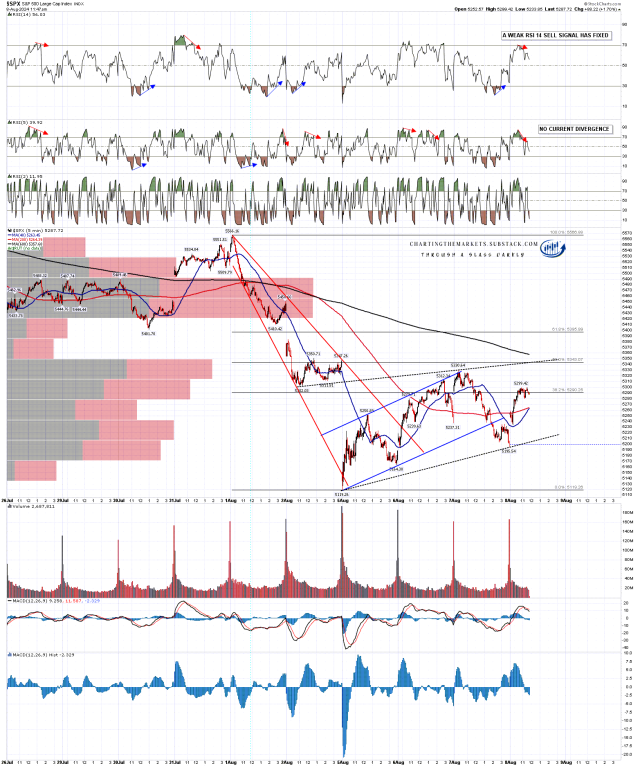
On SPX there was a strong break of the bear flag yesterday, 5min RSI 14 buy signals fixed near the lows on all of SPX, NDX, IWM and Dow, and played out this morning. A weak 5min RSI 14 sell signal has now fixed on SPX and it may be that the indices will turn back down here into the retest of Monday’s lows.
There is the option here though that the bear flag that broke down was just the A wave of an ABC rally bear flag and, if so, I have drawn in the obvious target trendline for a larger bear flag wedge, currently in the 5343 area very close to the 50% retracement of the decline. If SPX makes a new rally high from here then that is a likely area that I will be watching.
SPX 5min chart:
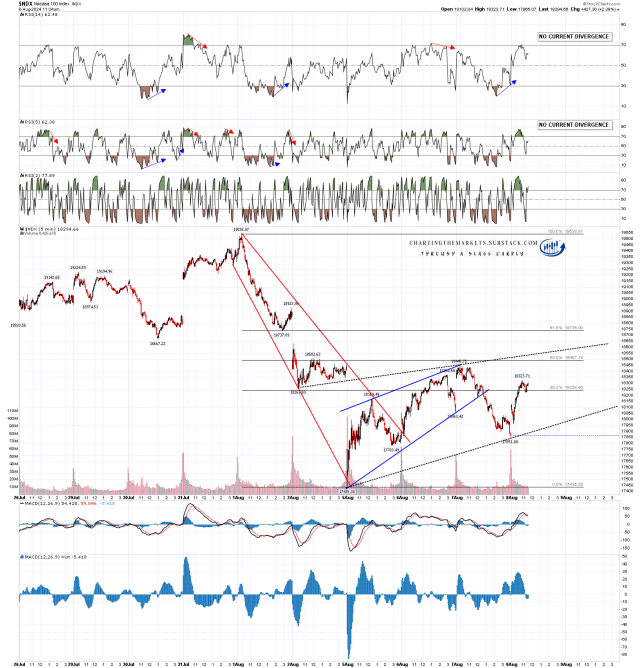
On the NDX 5min chart there is an equivalent scenario with an ideal trendline target on a possible larger bear flag wedge pattern currently in the 18,550 area, slightly over the 50% retracement of the decline.
NDX 5min chart:
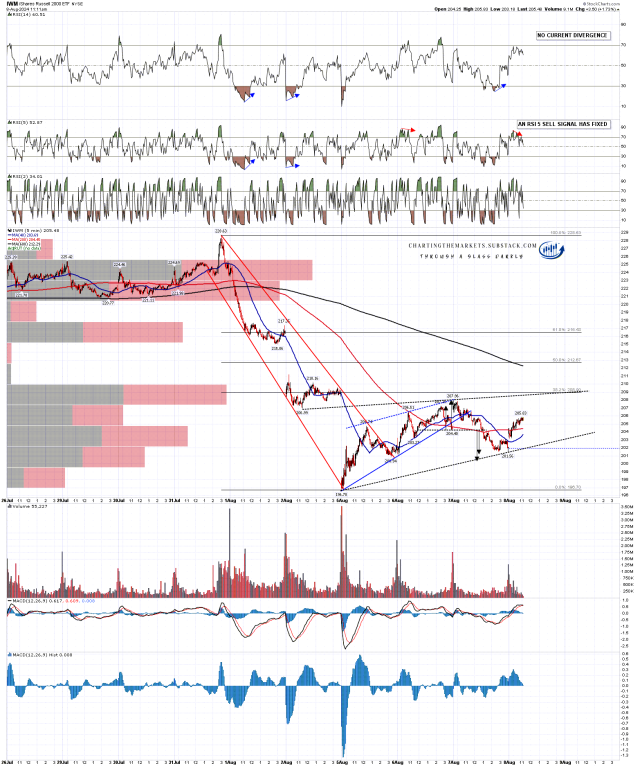
On IWM and Dow the rallies have been weaker, but there are equivalent setups on both with trendline targets close to the 38.2% fib retracements of the decline. On IWM that target is in the 208.75 area.
IWM 5min chart:
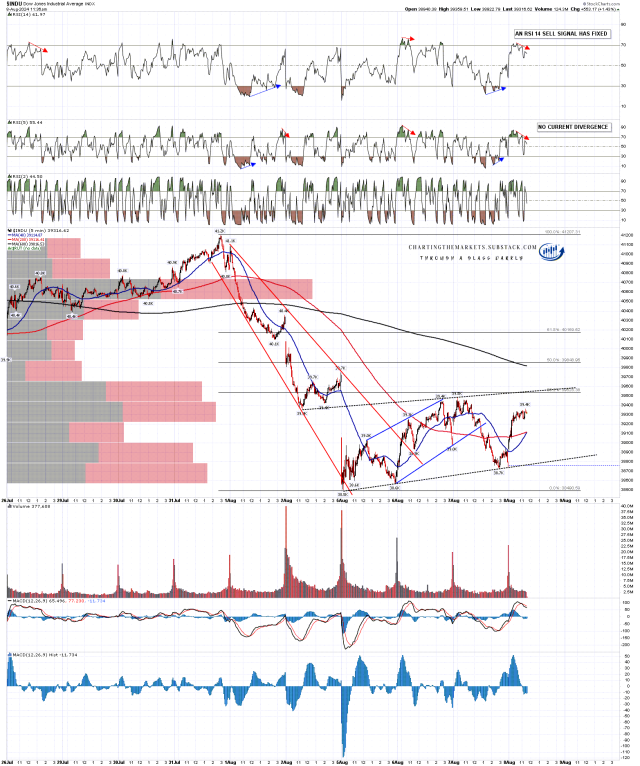
On Dow that target is currently in the 39,550 area.
INDU 5min chart:
Obviously if the larger flags form there is the caveat that I mentioned yesterday that 30% of the time bear flags break up rather than down, and the flag itself can be the reversal pattern, but that is of course the lower probability option.
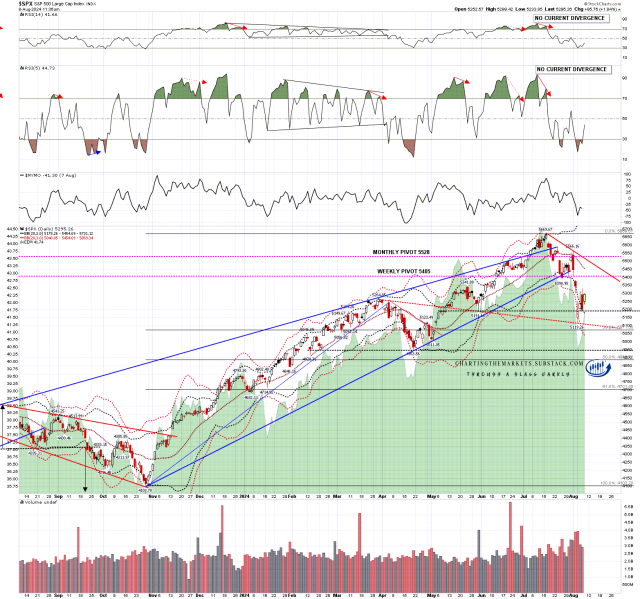
My last chart of the day is to show a possible bigger picture bull flag forming on the SPX chart. I’ve been looking for obvious target trendlines and levels if equity indices go lower and came across this very interesting possible bull flag wedge support trendline on SPX. I’ve show that as a red dashed trendline running from the late March high, through the June low, into Monday’s low, and this would in my view be a classic bull flag wedge support trendline, so I’m considering it seriously.
If we do see a retest of Monday’s low, and that holds, then that may make the second low of a double bottom and the bigger target would be the flag wedge resistance currently in the 5500 area and, on a break above that, a possible double bottom target likely in the 5580 – 5650 range. A hard break of this support trendline would open lower targets.
SPX daily BBs chart:
You can now find my work at chartingthemarkets.substack.com and on my twitter (shjcharts). I’m still configuring my substacks for the rest of the week and while I’m doing that my premarket webinars are free to all, with the links posted shortly before on my twitter). I’m planning to get into a routine of doing a premarket webinar every day on cryptos at 8.45am EST, with the first one done this morning, and a premarket webinar every day on equity indices and futures at 9.00am EST.
