
There is a decent correlation between the trends on equity indices and Crypto, as I’ve mentioned before, and we are seeing a small but significant looking inflection point on both of them today that I was looking at in my premarket video on Crypto today.
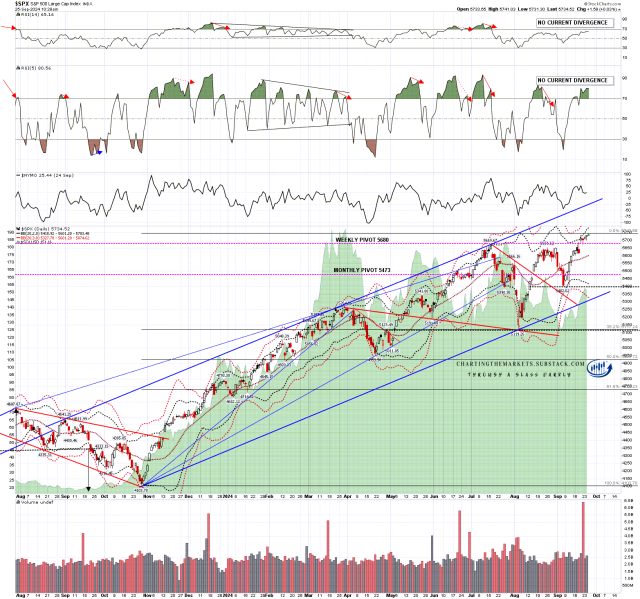
The chart below shows one of my SPX daily charts with SOLUSD in the background. You can see the possible small double top setup on SPX here, and I have a similar setup on SOLUSD (Solana) and BTCUSD (Bitcoin), both of which I will be showing further below. The correlation isn’t perfect, but it is strong.
SPX daily BBs vs SOLUSD chart:
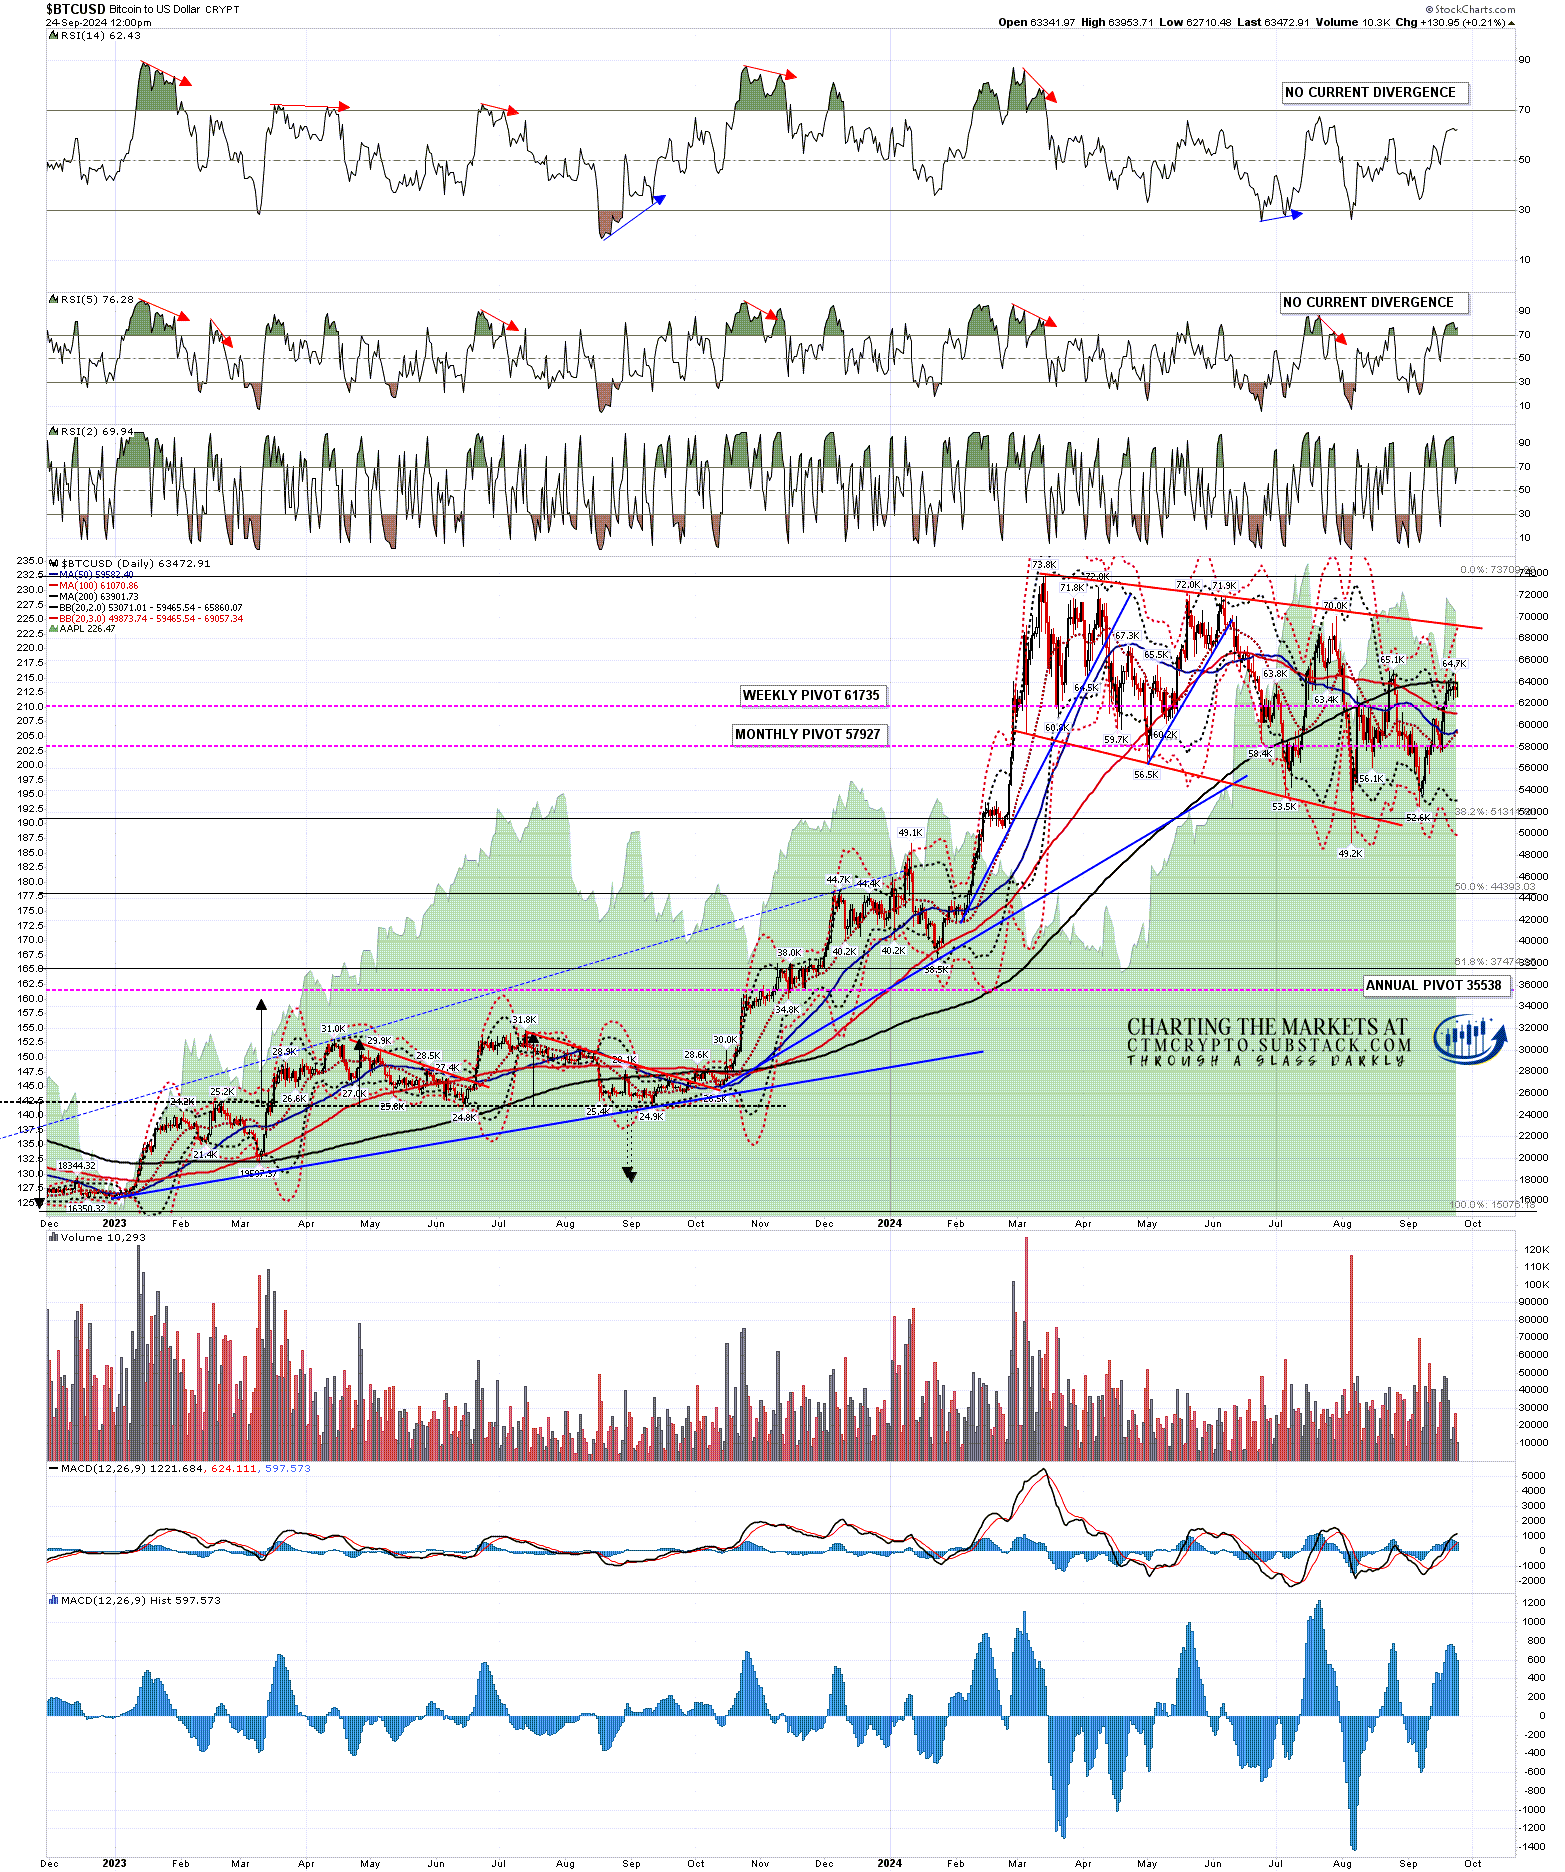
On Bitcoin there is no negative RSI divergence currently on the daily chart, but it has been stalled the last few days at the test from below of obvious resistance at the 200dma, currently at 63882. If we are going to see a retracement or serious reversal then this would be a really obvious place to see that.
BTCUSD daily chart:
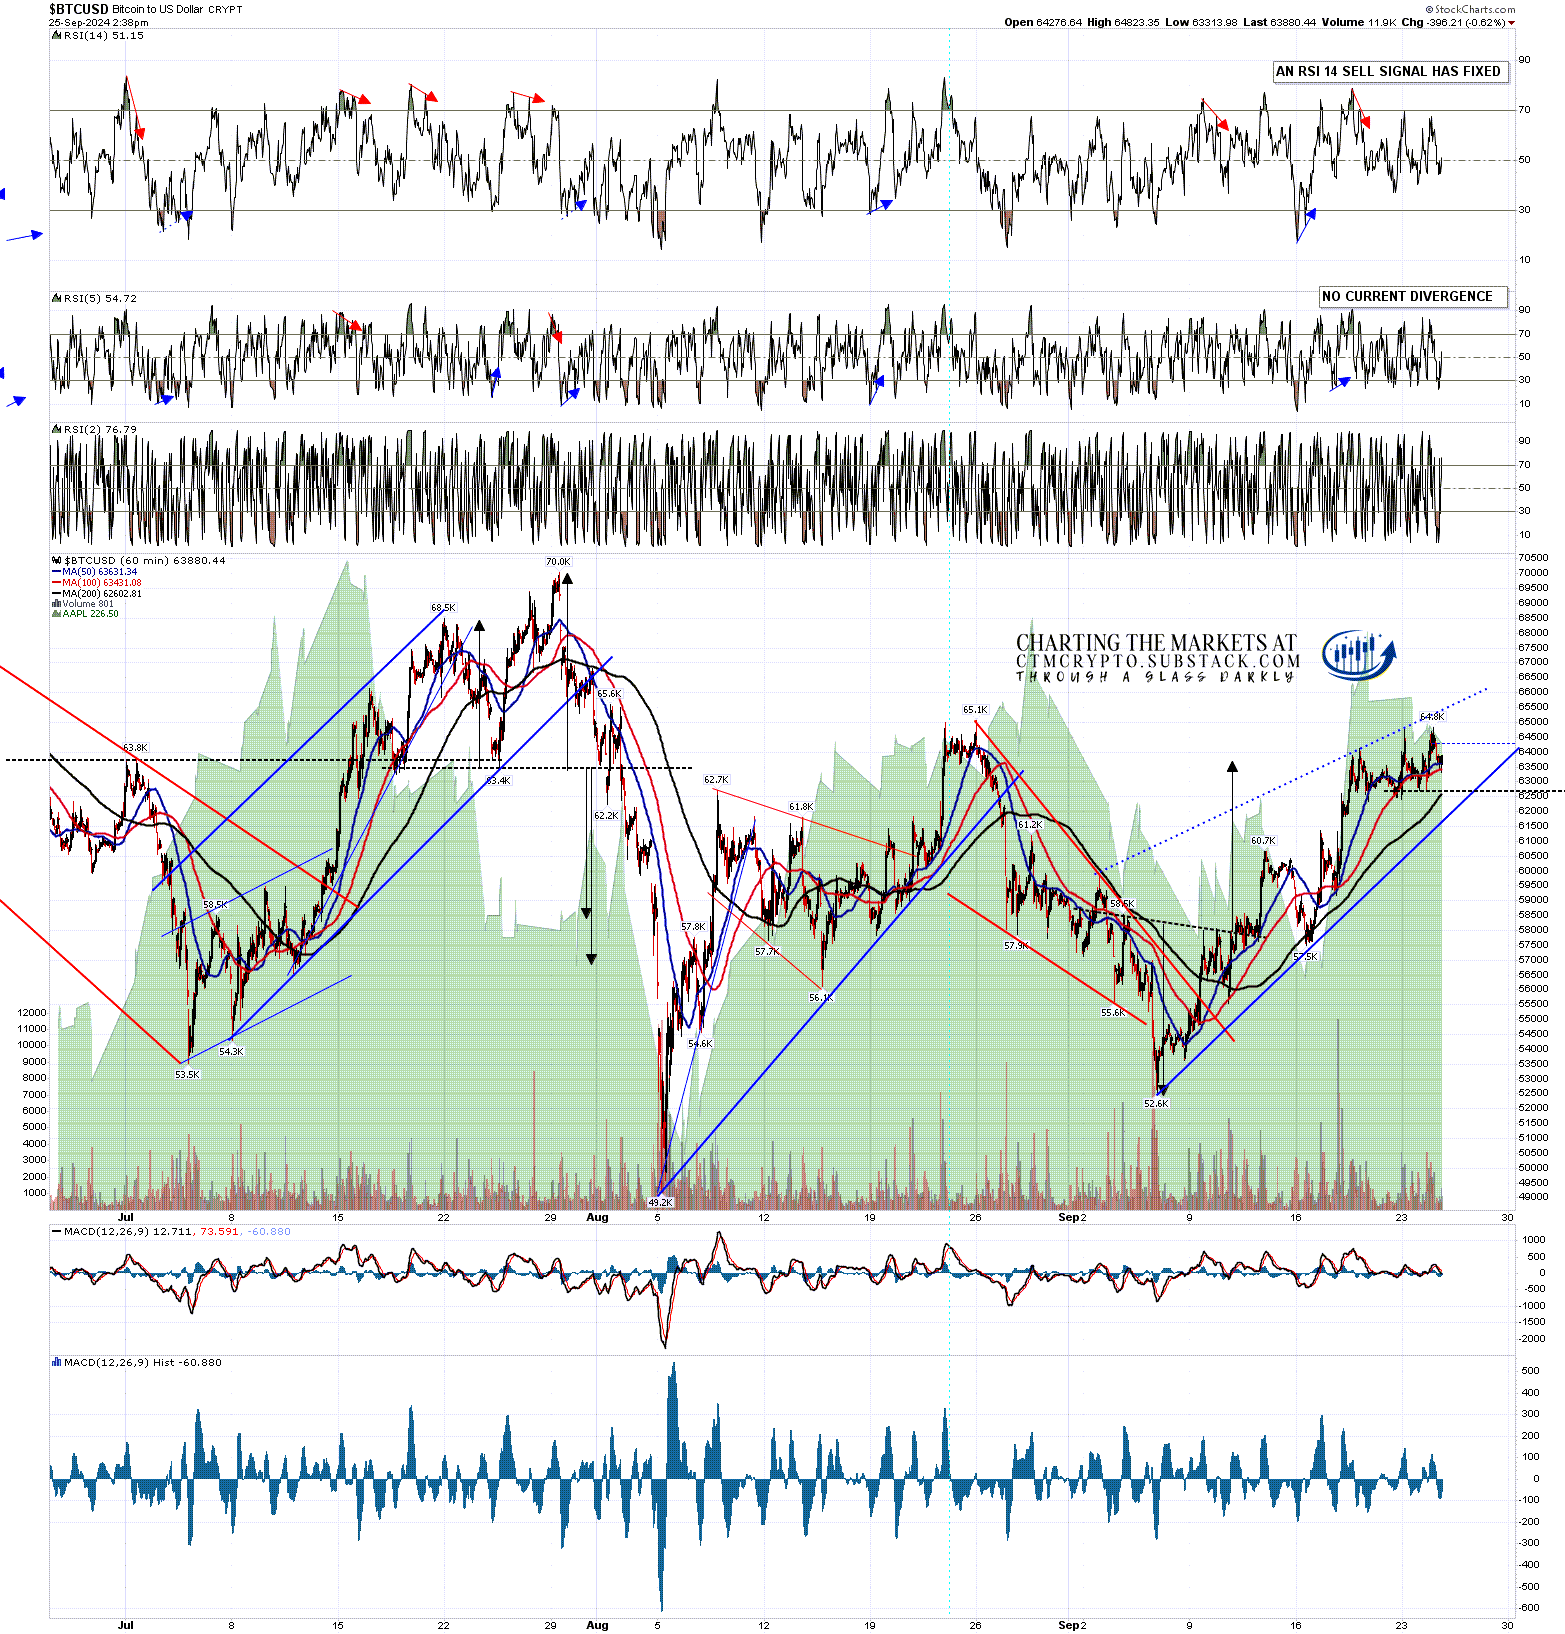
On the Bitcoin hourly chart there is an ok quality rising wedge, an open hourly RSI 14 sell signal and a small double top setup has formed that on a break below 62.7k would look for a target in the 60.6k to 60.7k area.
BTCUSD 60min chart:
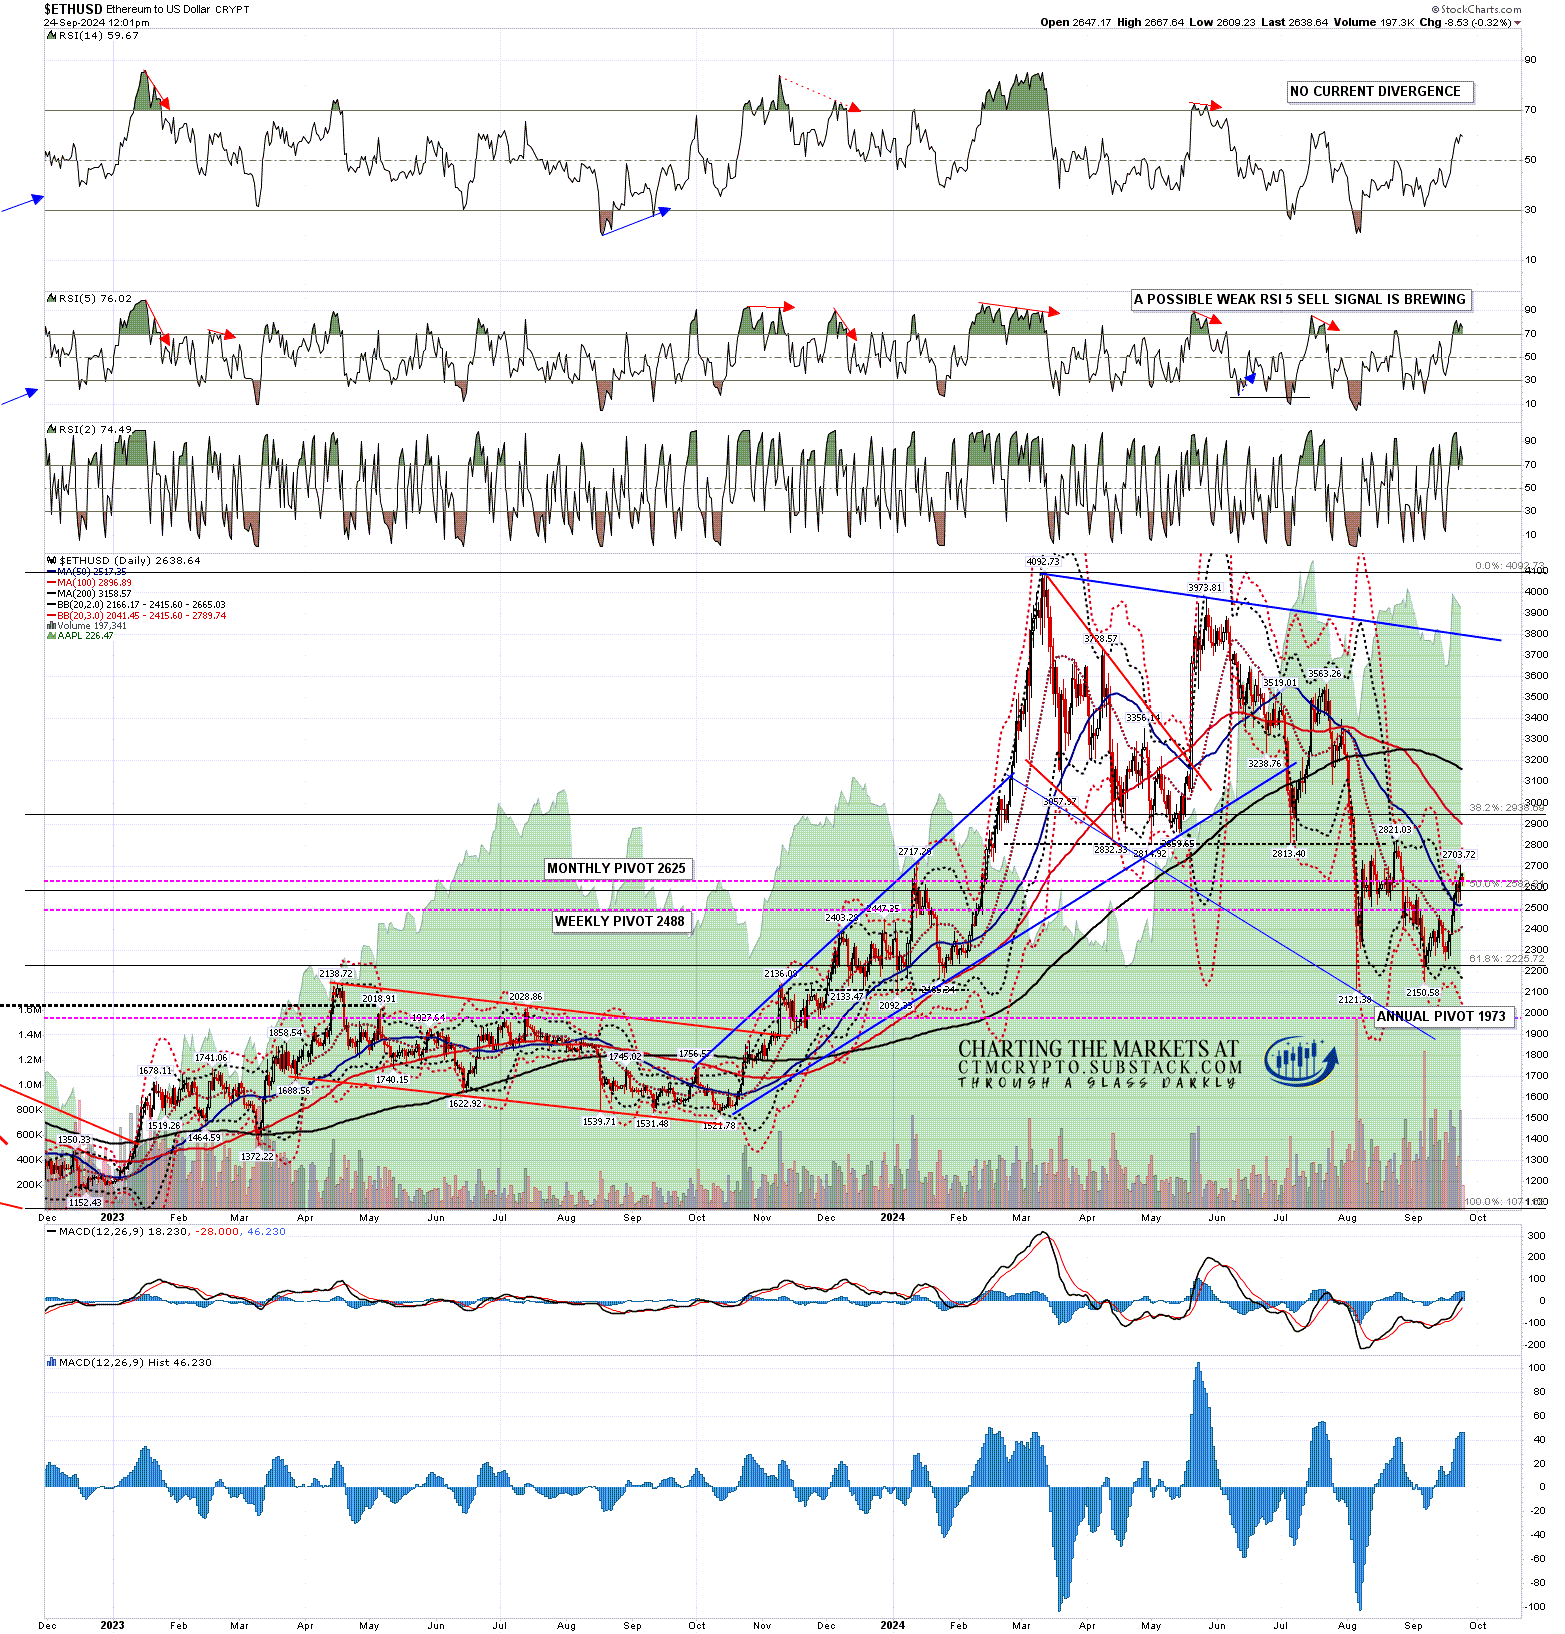
On the ETHUSD (Ethereum) daily chart there was a touch of the daily 3sd upper band a couple of days ago, normally a decent indicator that a retracement or consolidation will happen next. There is a possible weak RSI 5 sell brewing there. There’s no obvious topping setup there but if that fixes then I would note that there are seven previous daily RSI 5 sell signals on the chart below, two of those weak, and all of them at least made the possible near miss target in the 35 area on the RSI 5. There is already an open RSI 14 sell signal on the hourly chart.
ETHUSD daily chart:
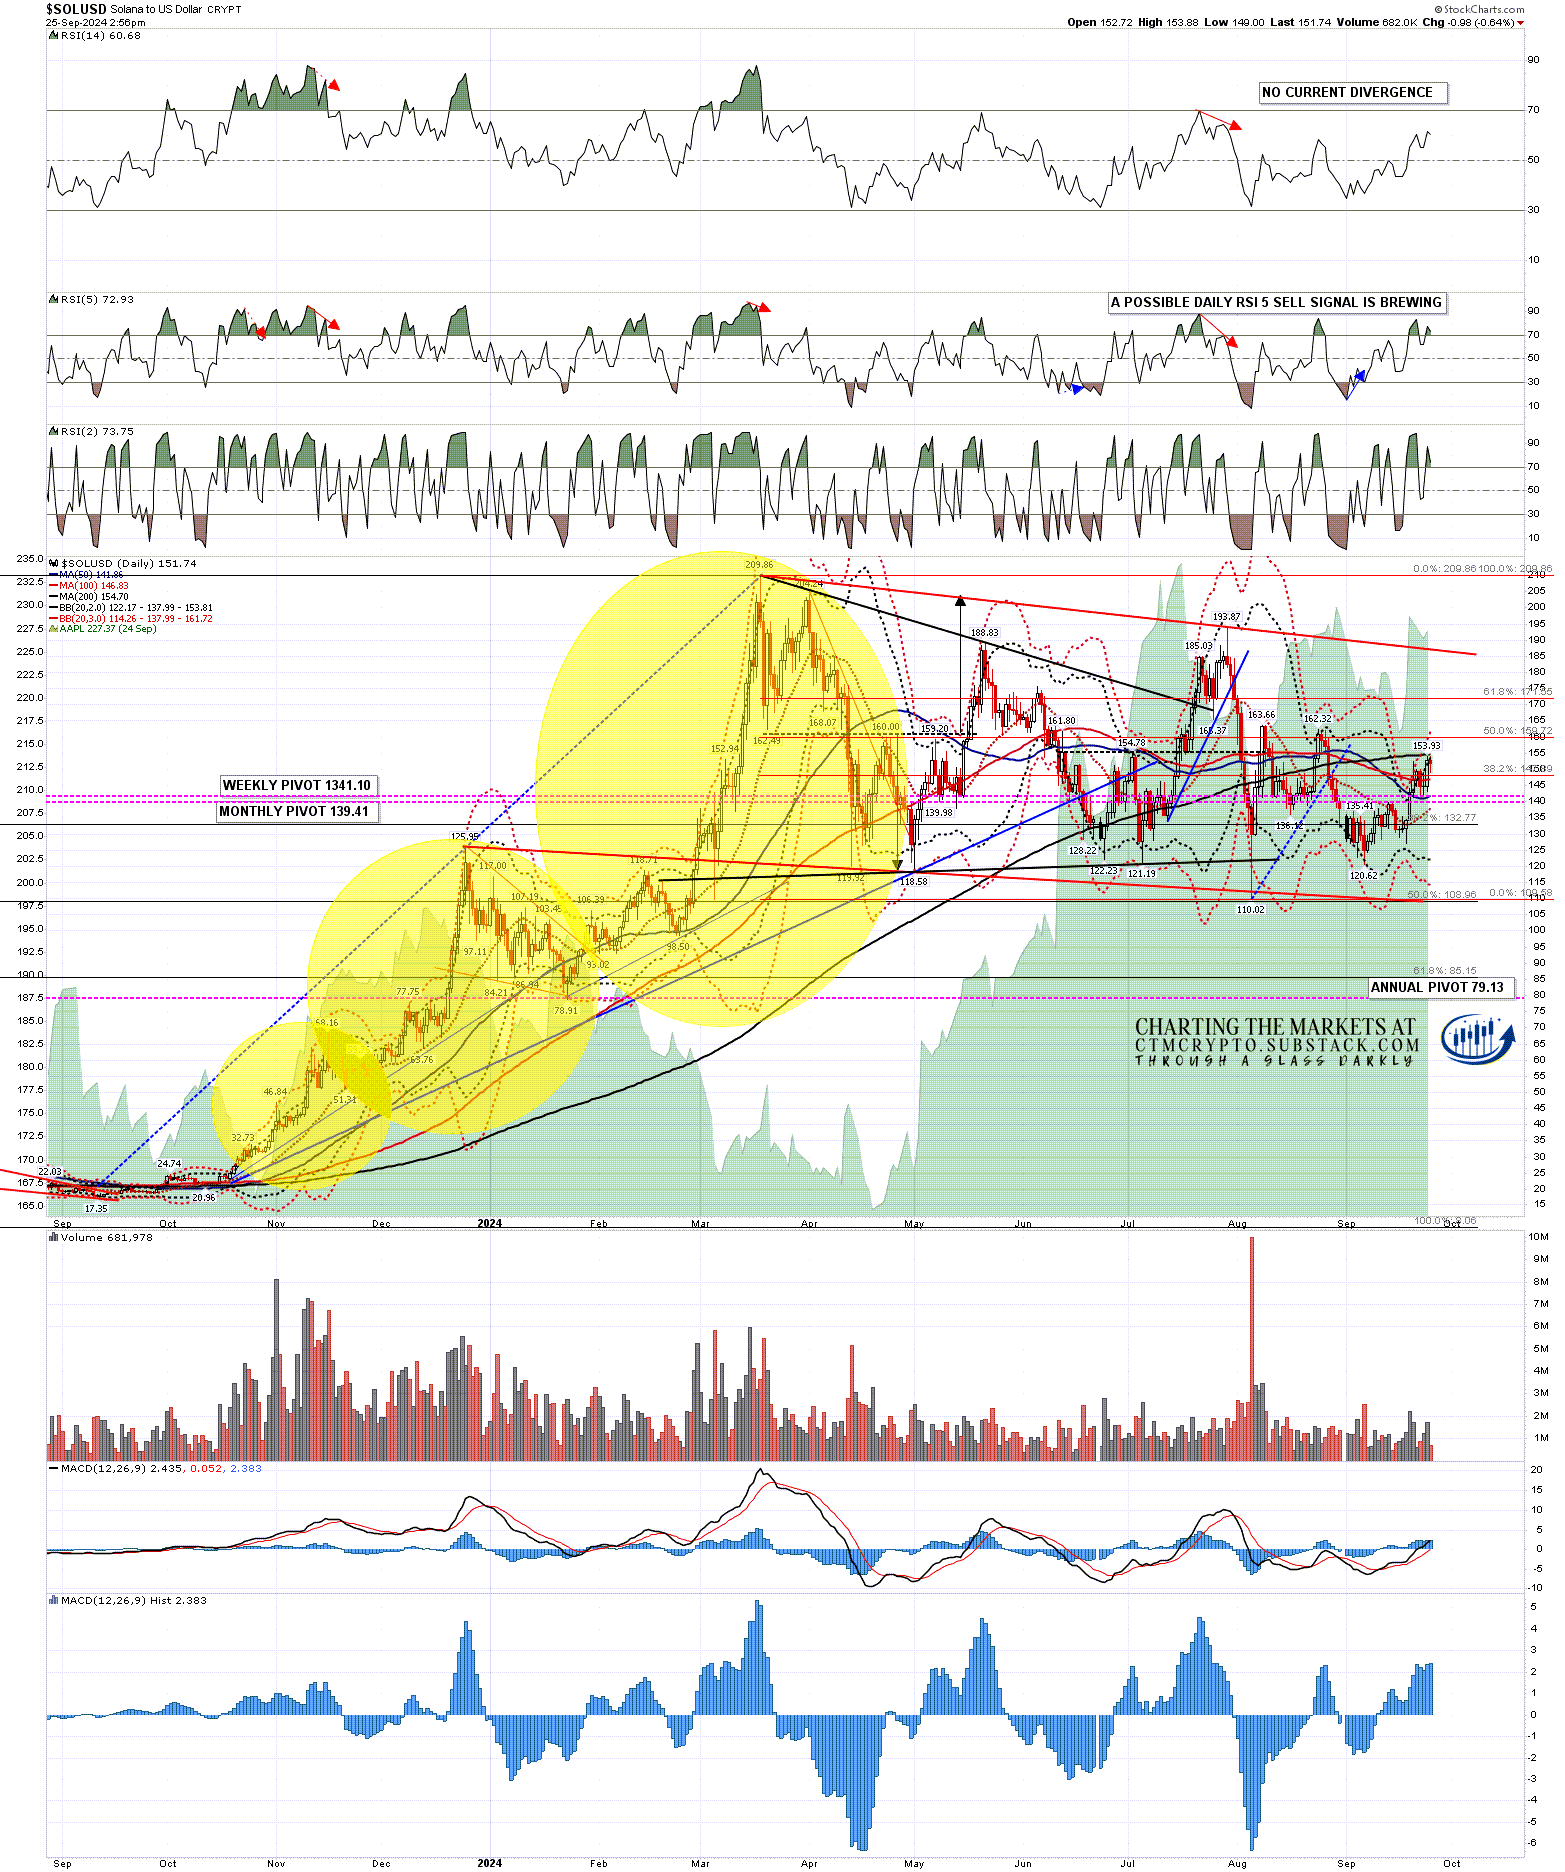
On Solana I’ve been talking so far this week in the premarket videos about the likely small bull flag that was forming and has now reached target at the retest of the prior high at 152.36. That has set up a possible double top and a possible full daily RSI 5 sell signal is brewing there. If this divergence fixes into a daily RSI 5 sell signal then here are four previous daily sell signals, three of which reached the possible near miss target.
Solana is also testing the 200dma, currently at 154.69, and that’s holding so far. As with Bitcoin, this is a very obvious fail area.
SOLUSD daily chart:
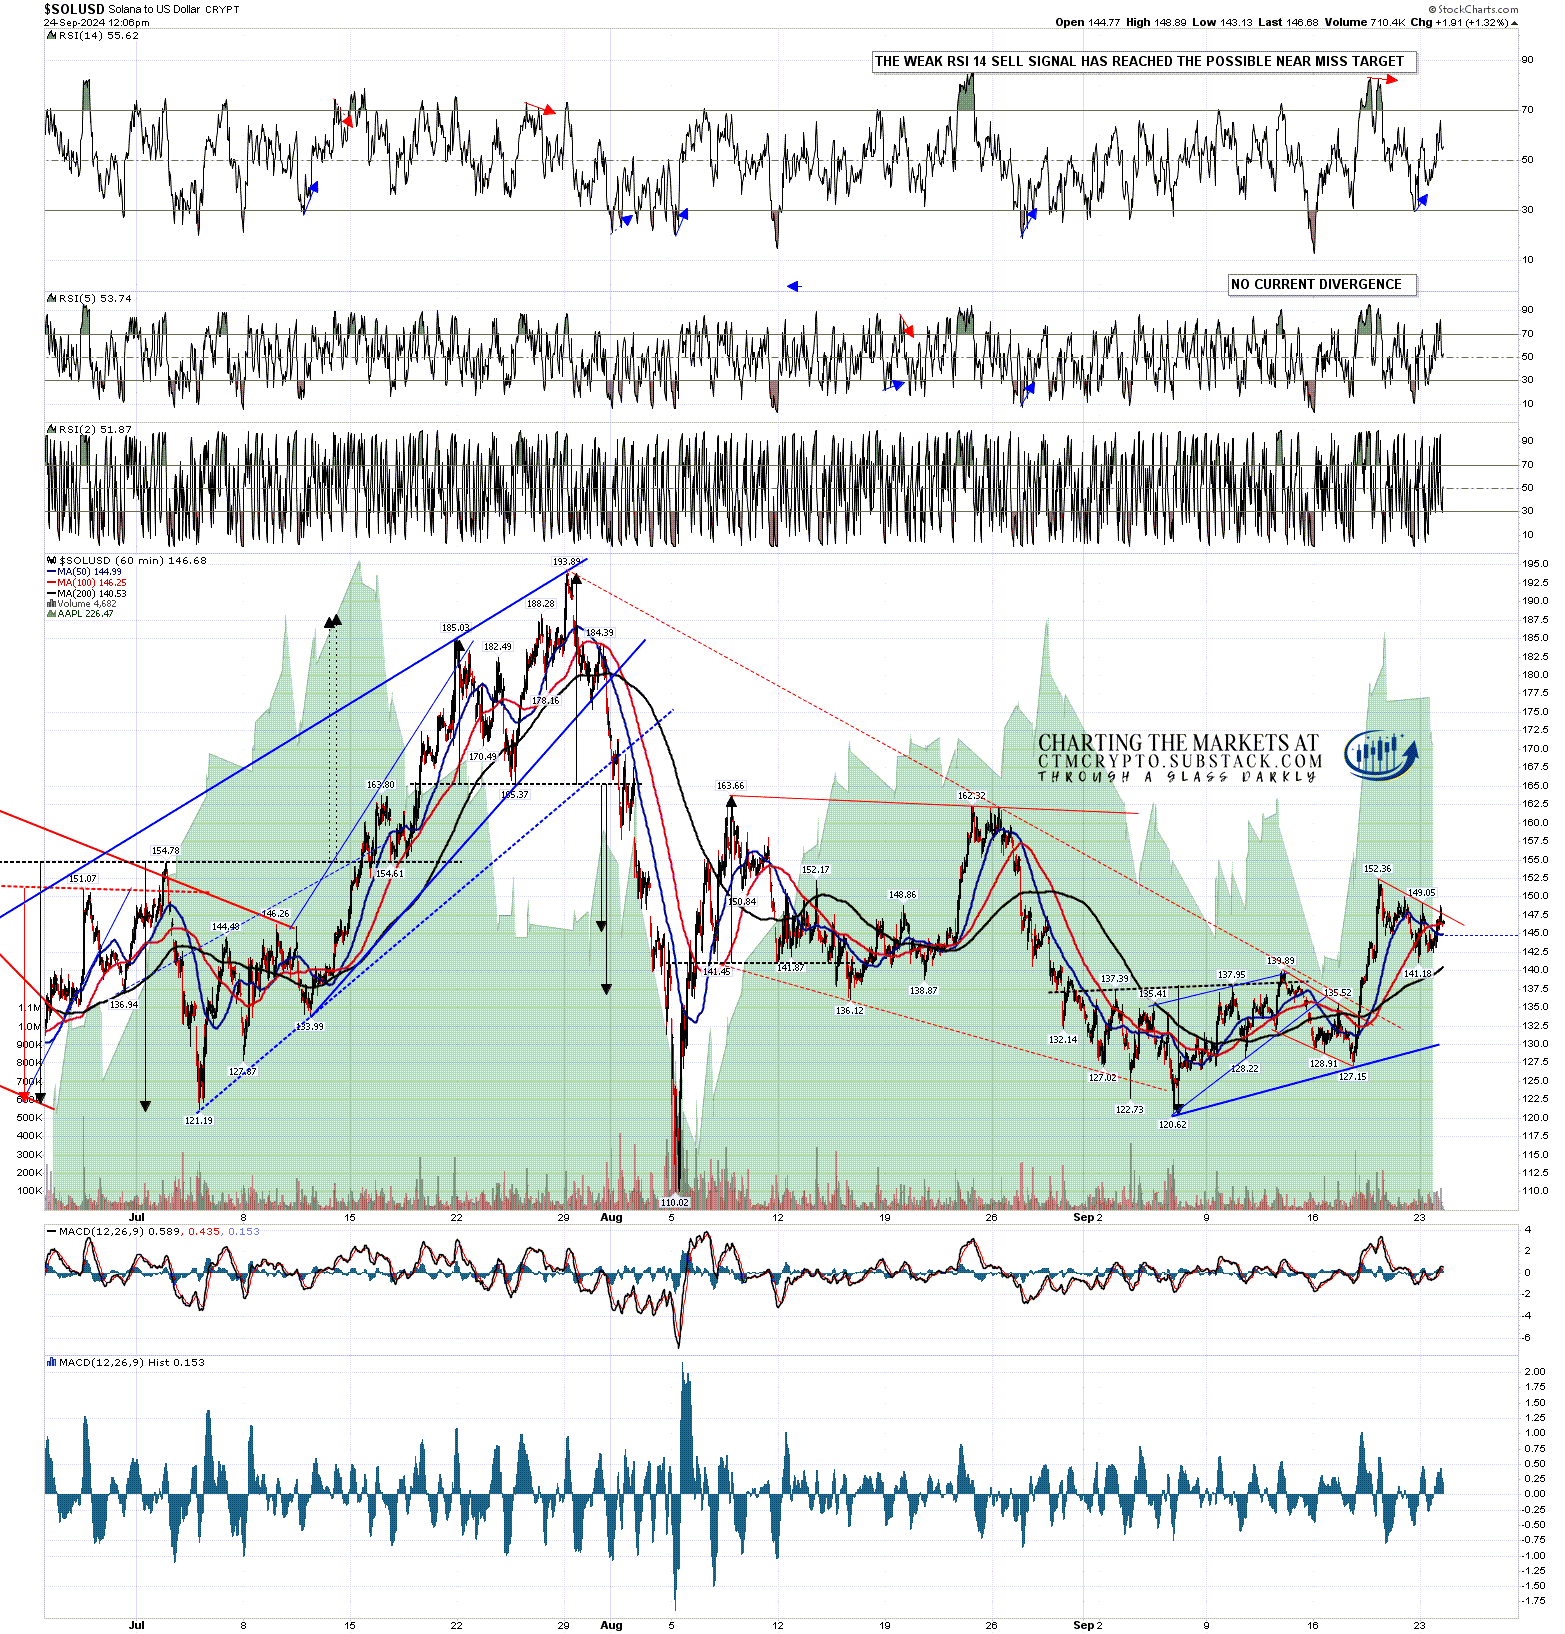
On the Solana hourly chart there is a very nice looking possible double top setup, and on a sustained break below double top support at 141.18, the double top target range would be in the 128.43 to 130 area.
SOLUSD 60min chart:
This is a good quality short term high setup, on Solana and Bitcoin particularly, backed up with strong resistance levels and some negative divergence on the daily chart. it also matches a small double top setup on SPX that I was saying in my other premarket video today, might well be about to deliver. We’ll see how that goes.
If you’d like to see more of these posts and the other Crypto videos and information I post, please subscribe for free to my Crypto substack.
I’m also to be found at Arion Partners, though as a student rather than as a teacher. I’ve been charting Cryptos for some years now, but am learning to trade and invest in them directly, and Arion Partners are my guide around a space that might reasonably be compared to the Wild West in one of their rougher years.

