
There’s an old saying from Mark Twain that history doesn’t repeat itself, but it often rhymes, meaning that the same patterns recur, but are never quite the same.
Back on Sunday 11th August I recorded a The Bigger Picture video in which I was looking at two possible bearish triangles on oil and gas. These weren’t at the same stage, but I have been thinking that they might well be part of the same possible overall sequence.
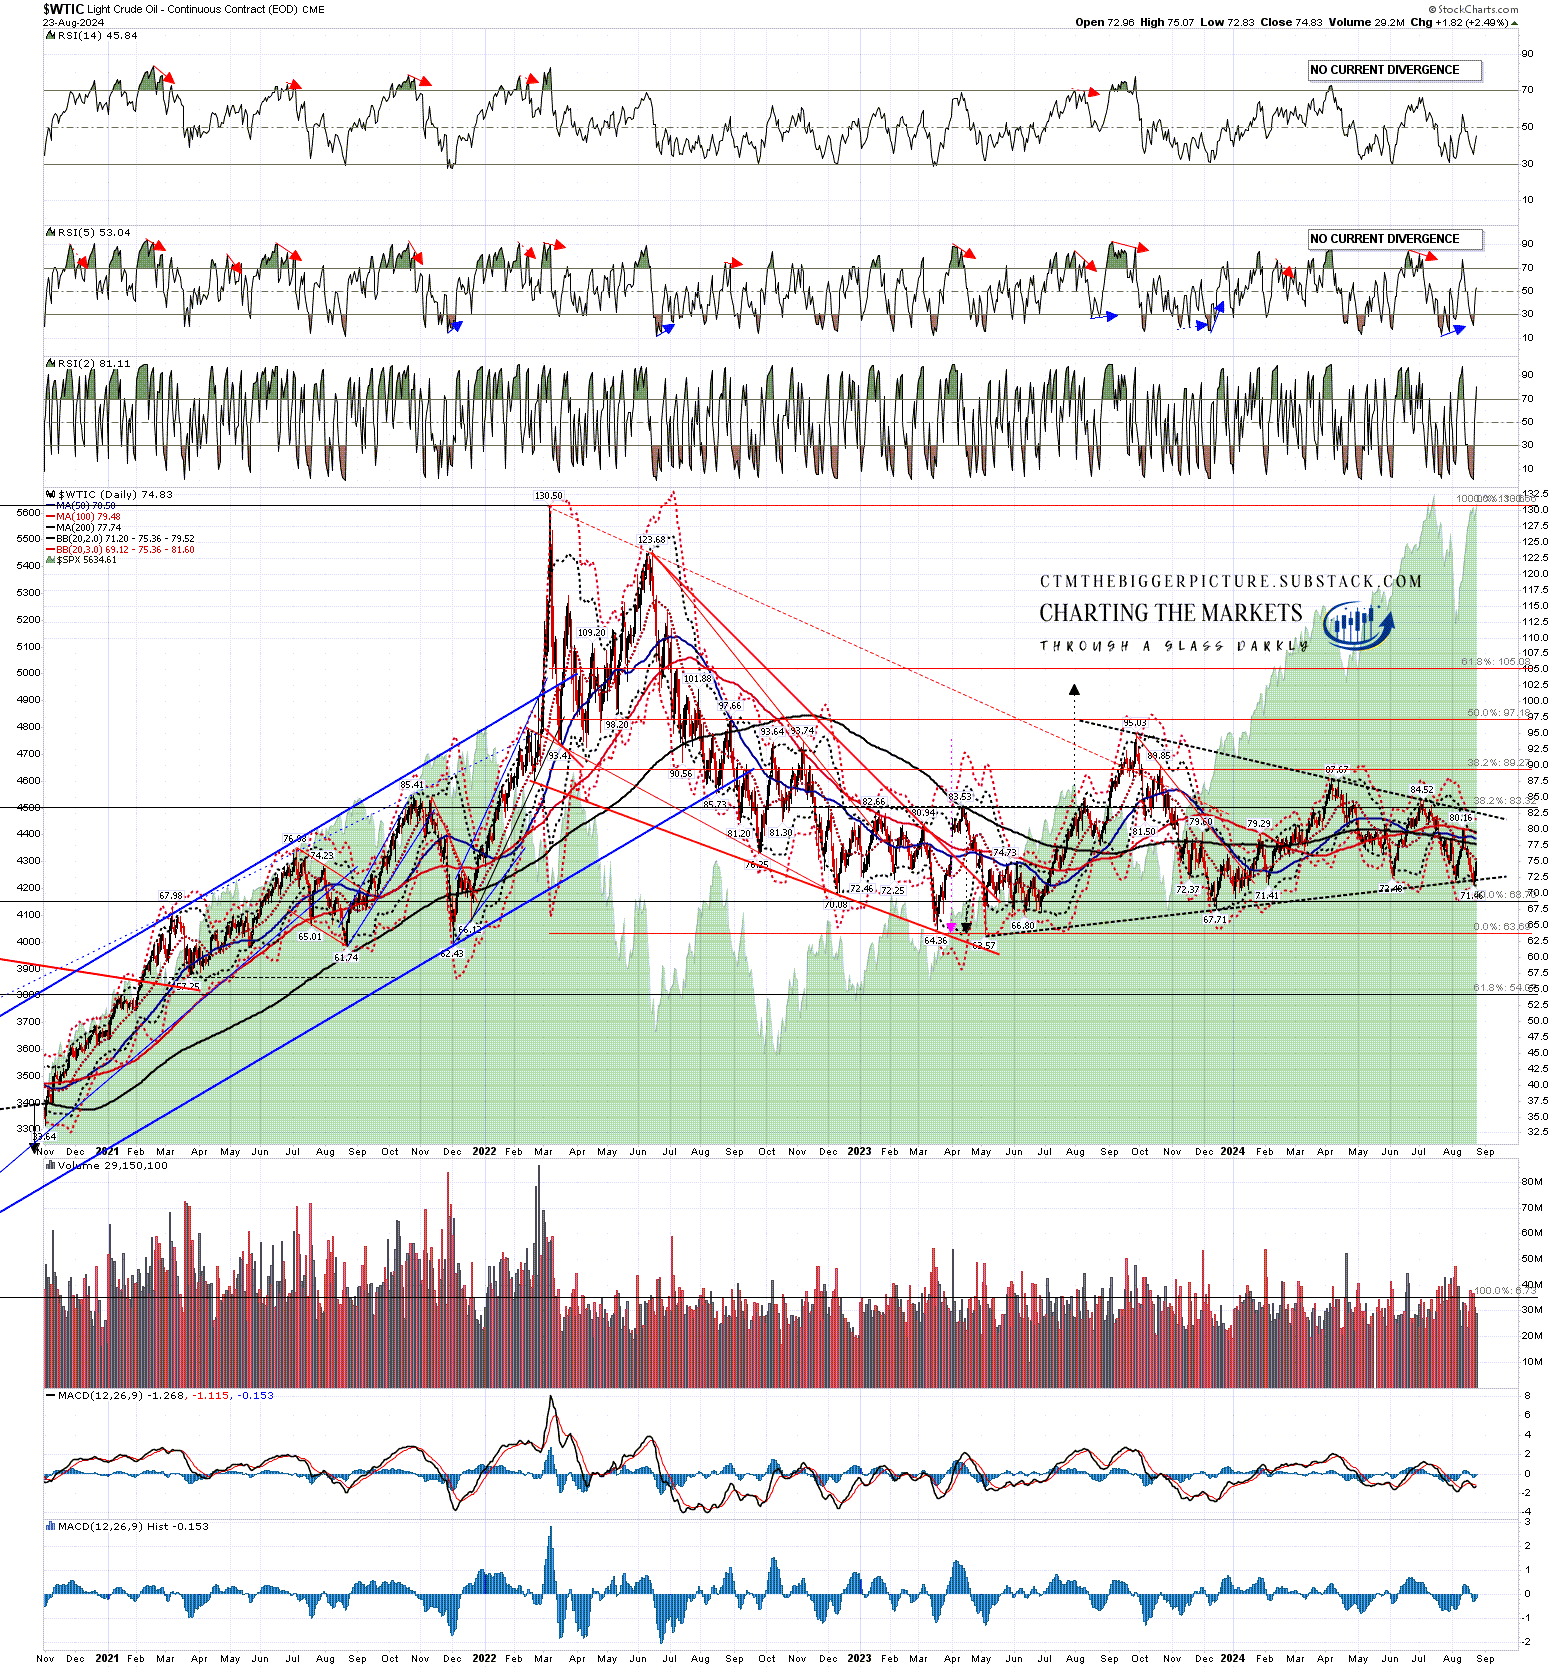
A couple of weeks later the triangle on oil (shown here on $WTIC), broke down with a minimum target at a retest of the 2023 low at 63.57. This is the chart I posted with The Bigger Picture video I recorded on 25th August.
WTIC daily chart from 25th August:
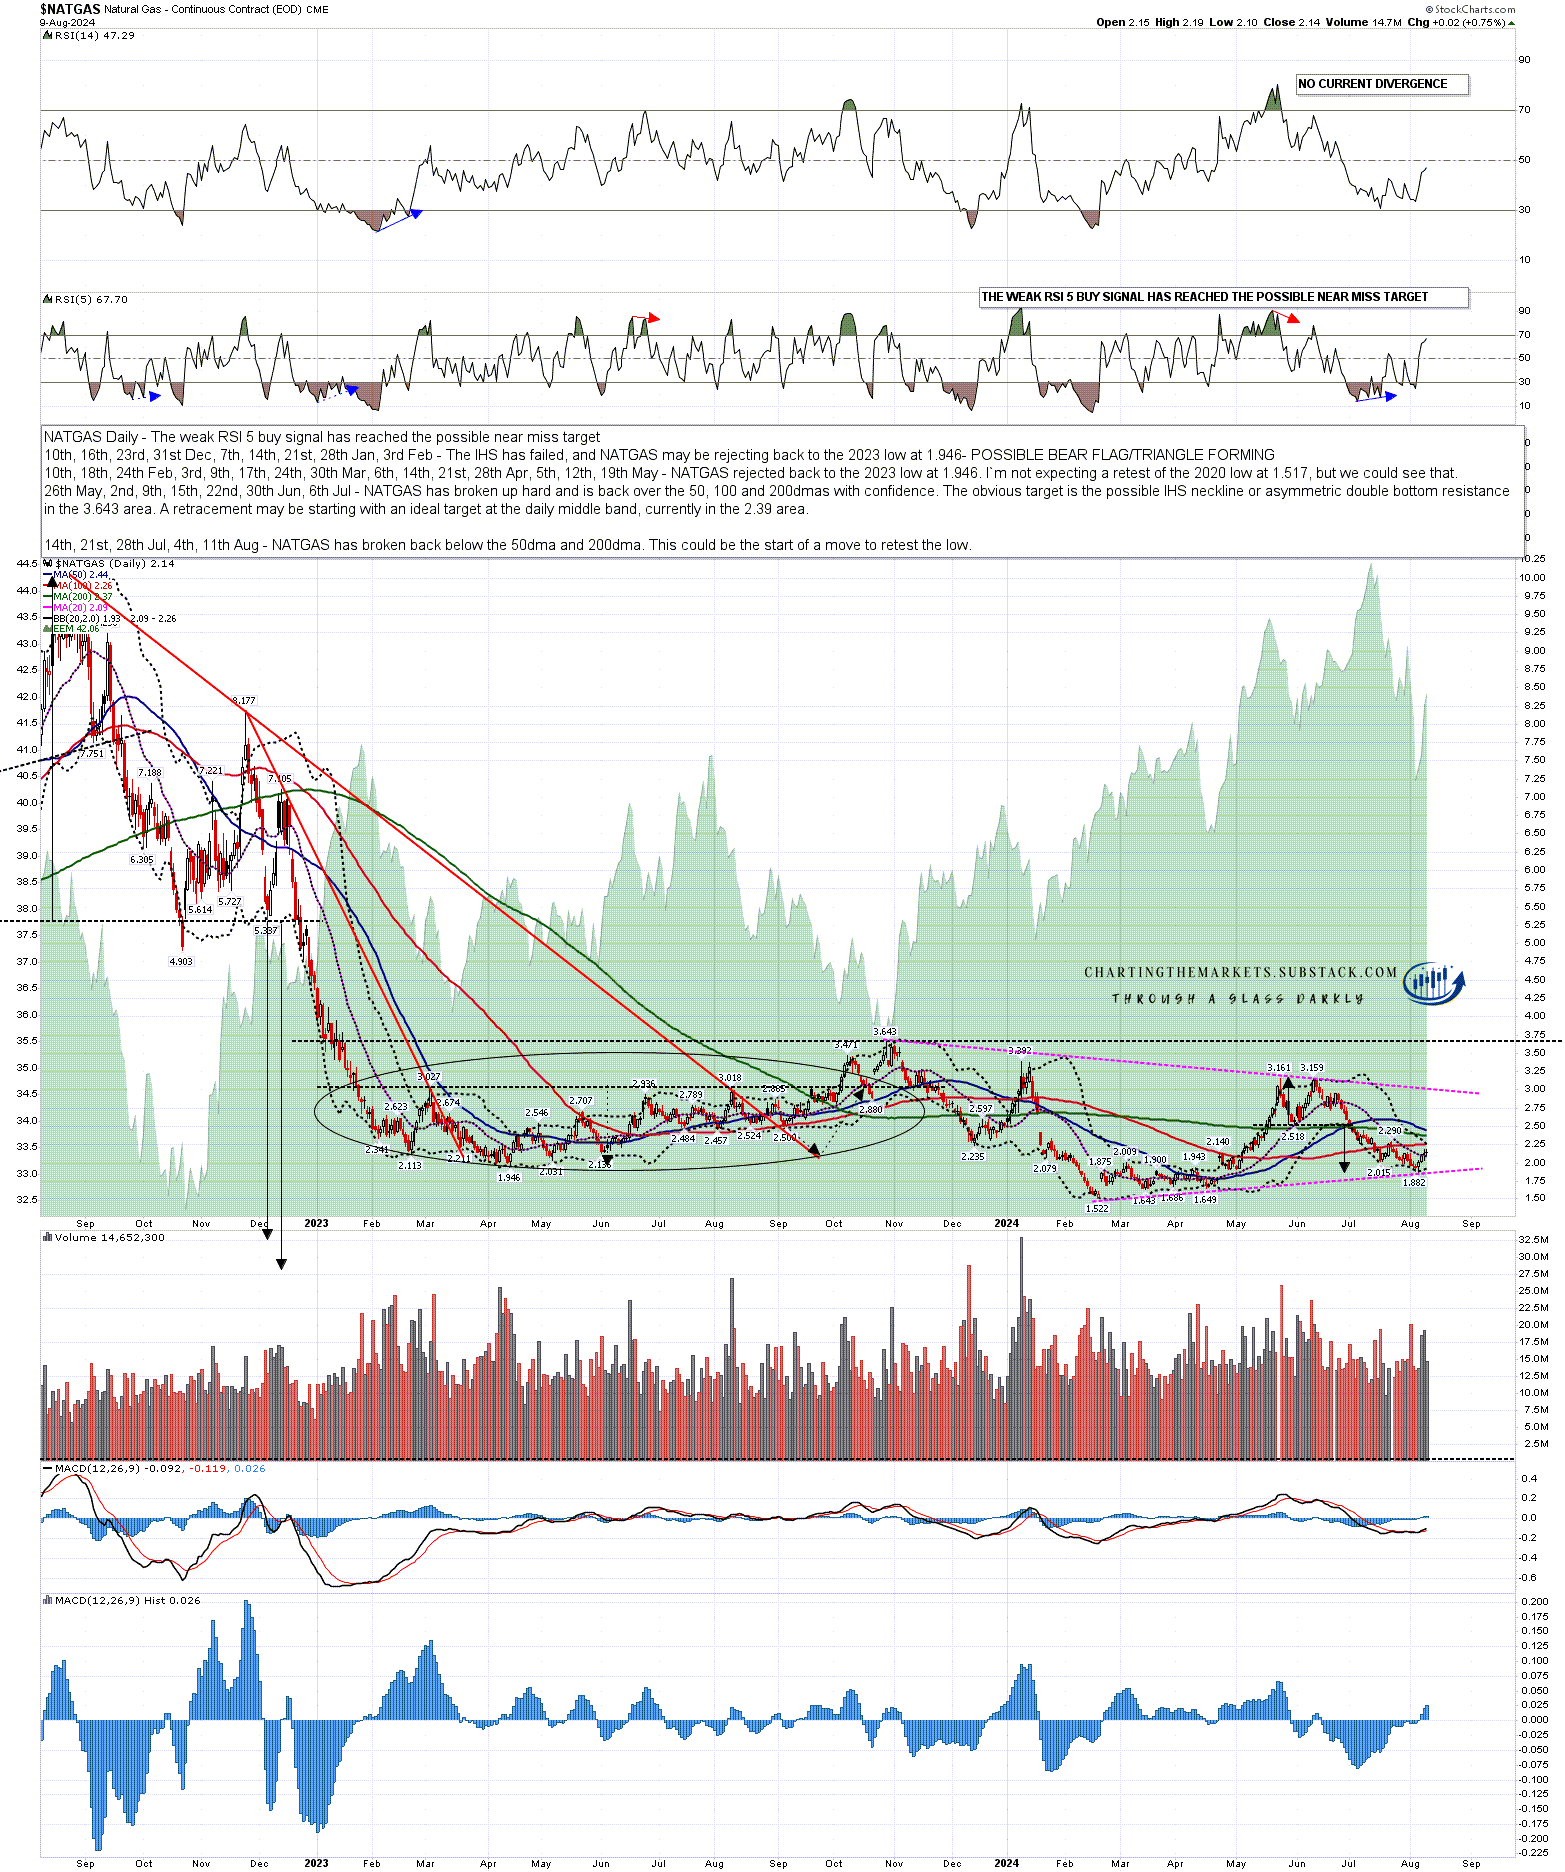
I was looking at the two triangles after the oil triangle broke down, and noted that they were at different stages, as the triangle on natural gas was not fully formed, and if it was going to continue forming, then the next obvious target would still be a test of triangle resistance currently in the 3.0 area. This is the chart I posted with The Bigger Picture video I recorded on 11th August.
NATGAS daily chart from 11th August:
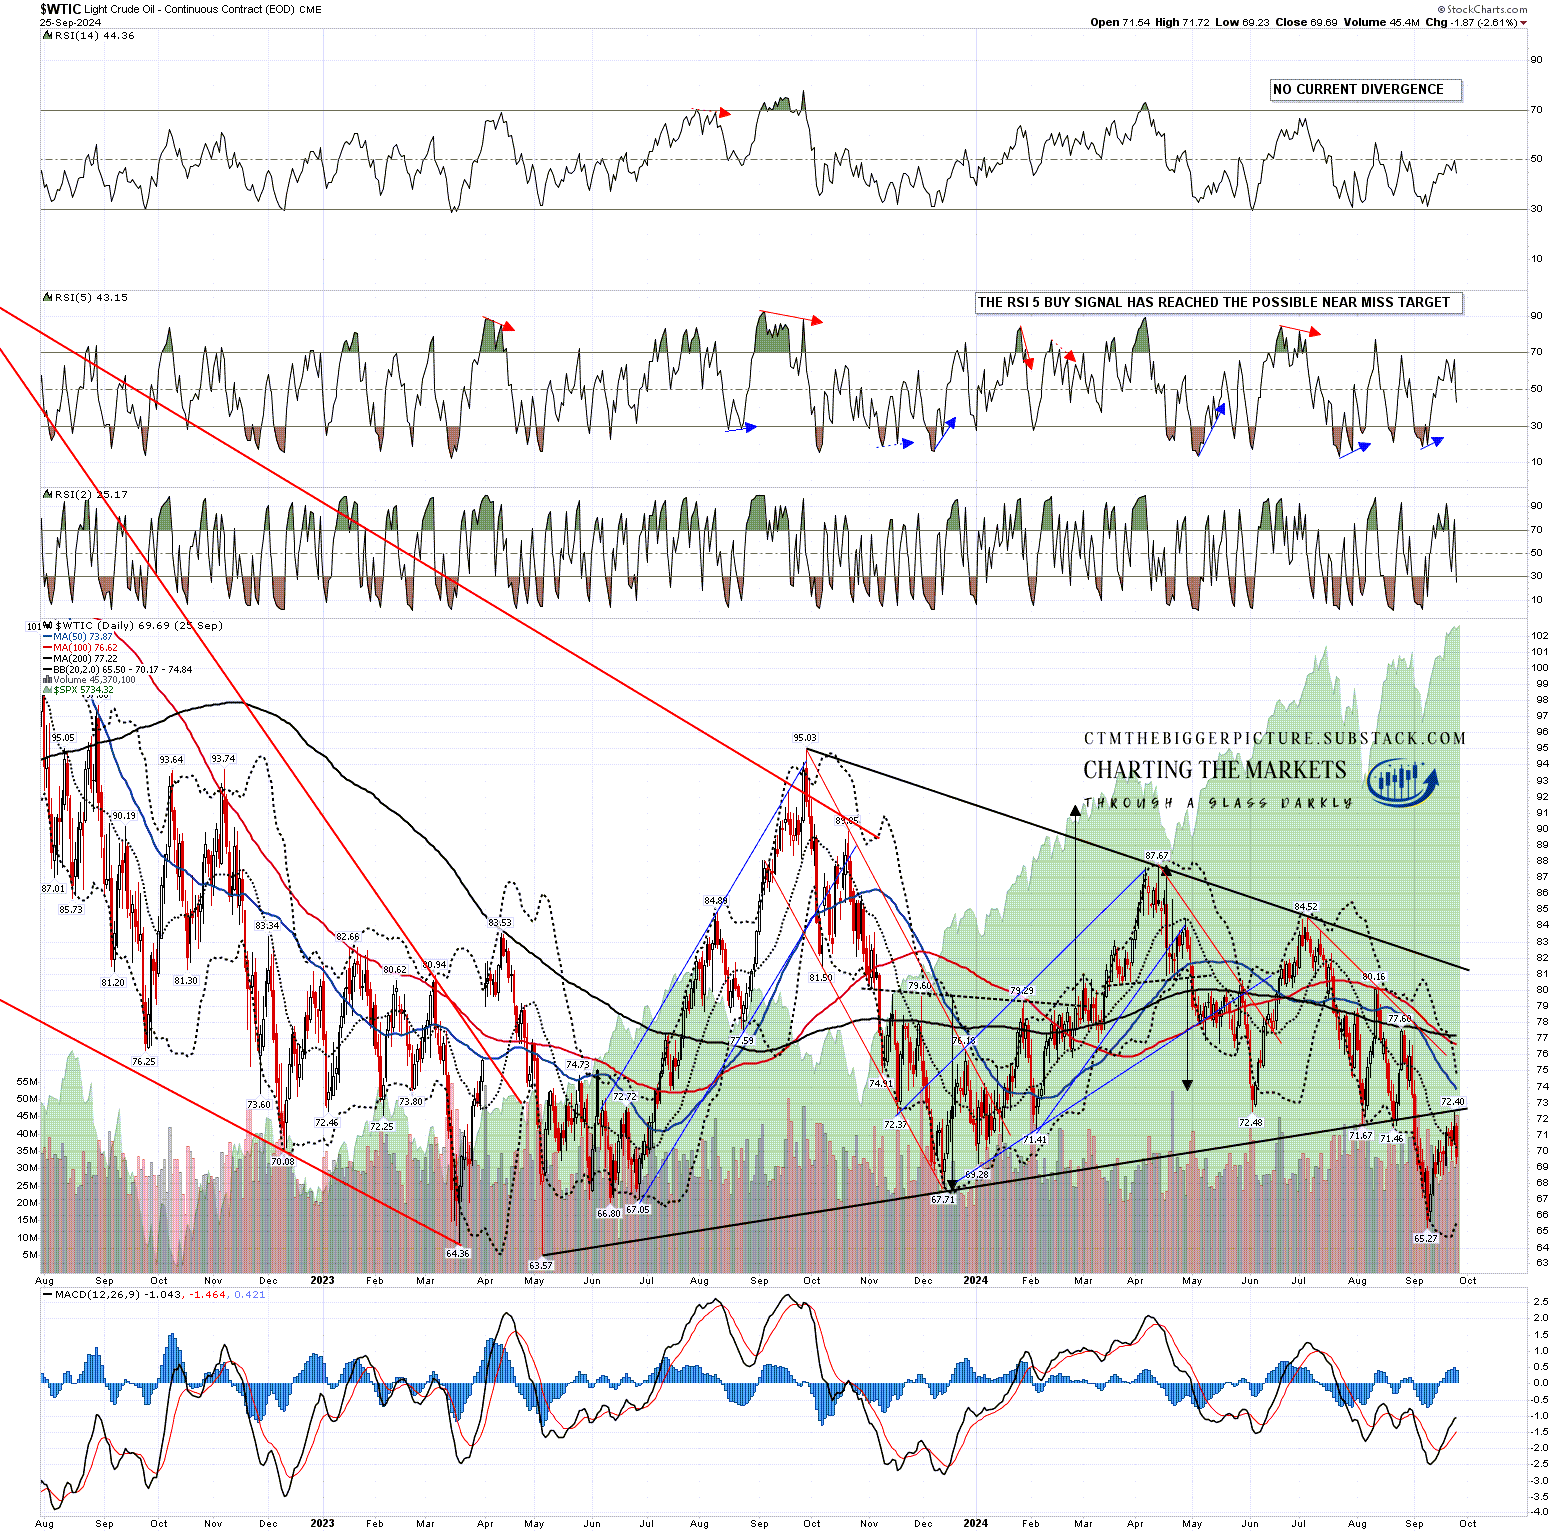
After the oil triangle broke down it made good progress towards the retest of the 2023 low, before starting a substantial rally that took oil to a perfect backtest of broken triangle support, which is holding so far. Oil has turned back down and the next obvious target is now a retest of that 2023 low at 63.57, and I think that it is likely that target will be hit in the next few weeks.
WTIC daily chart:
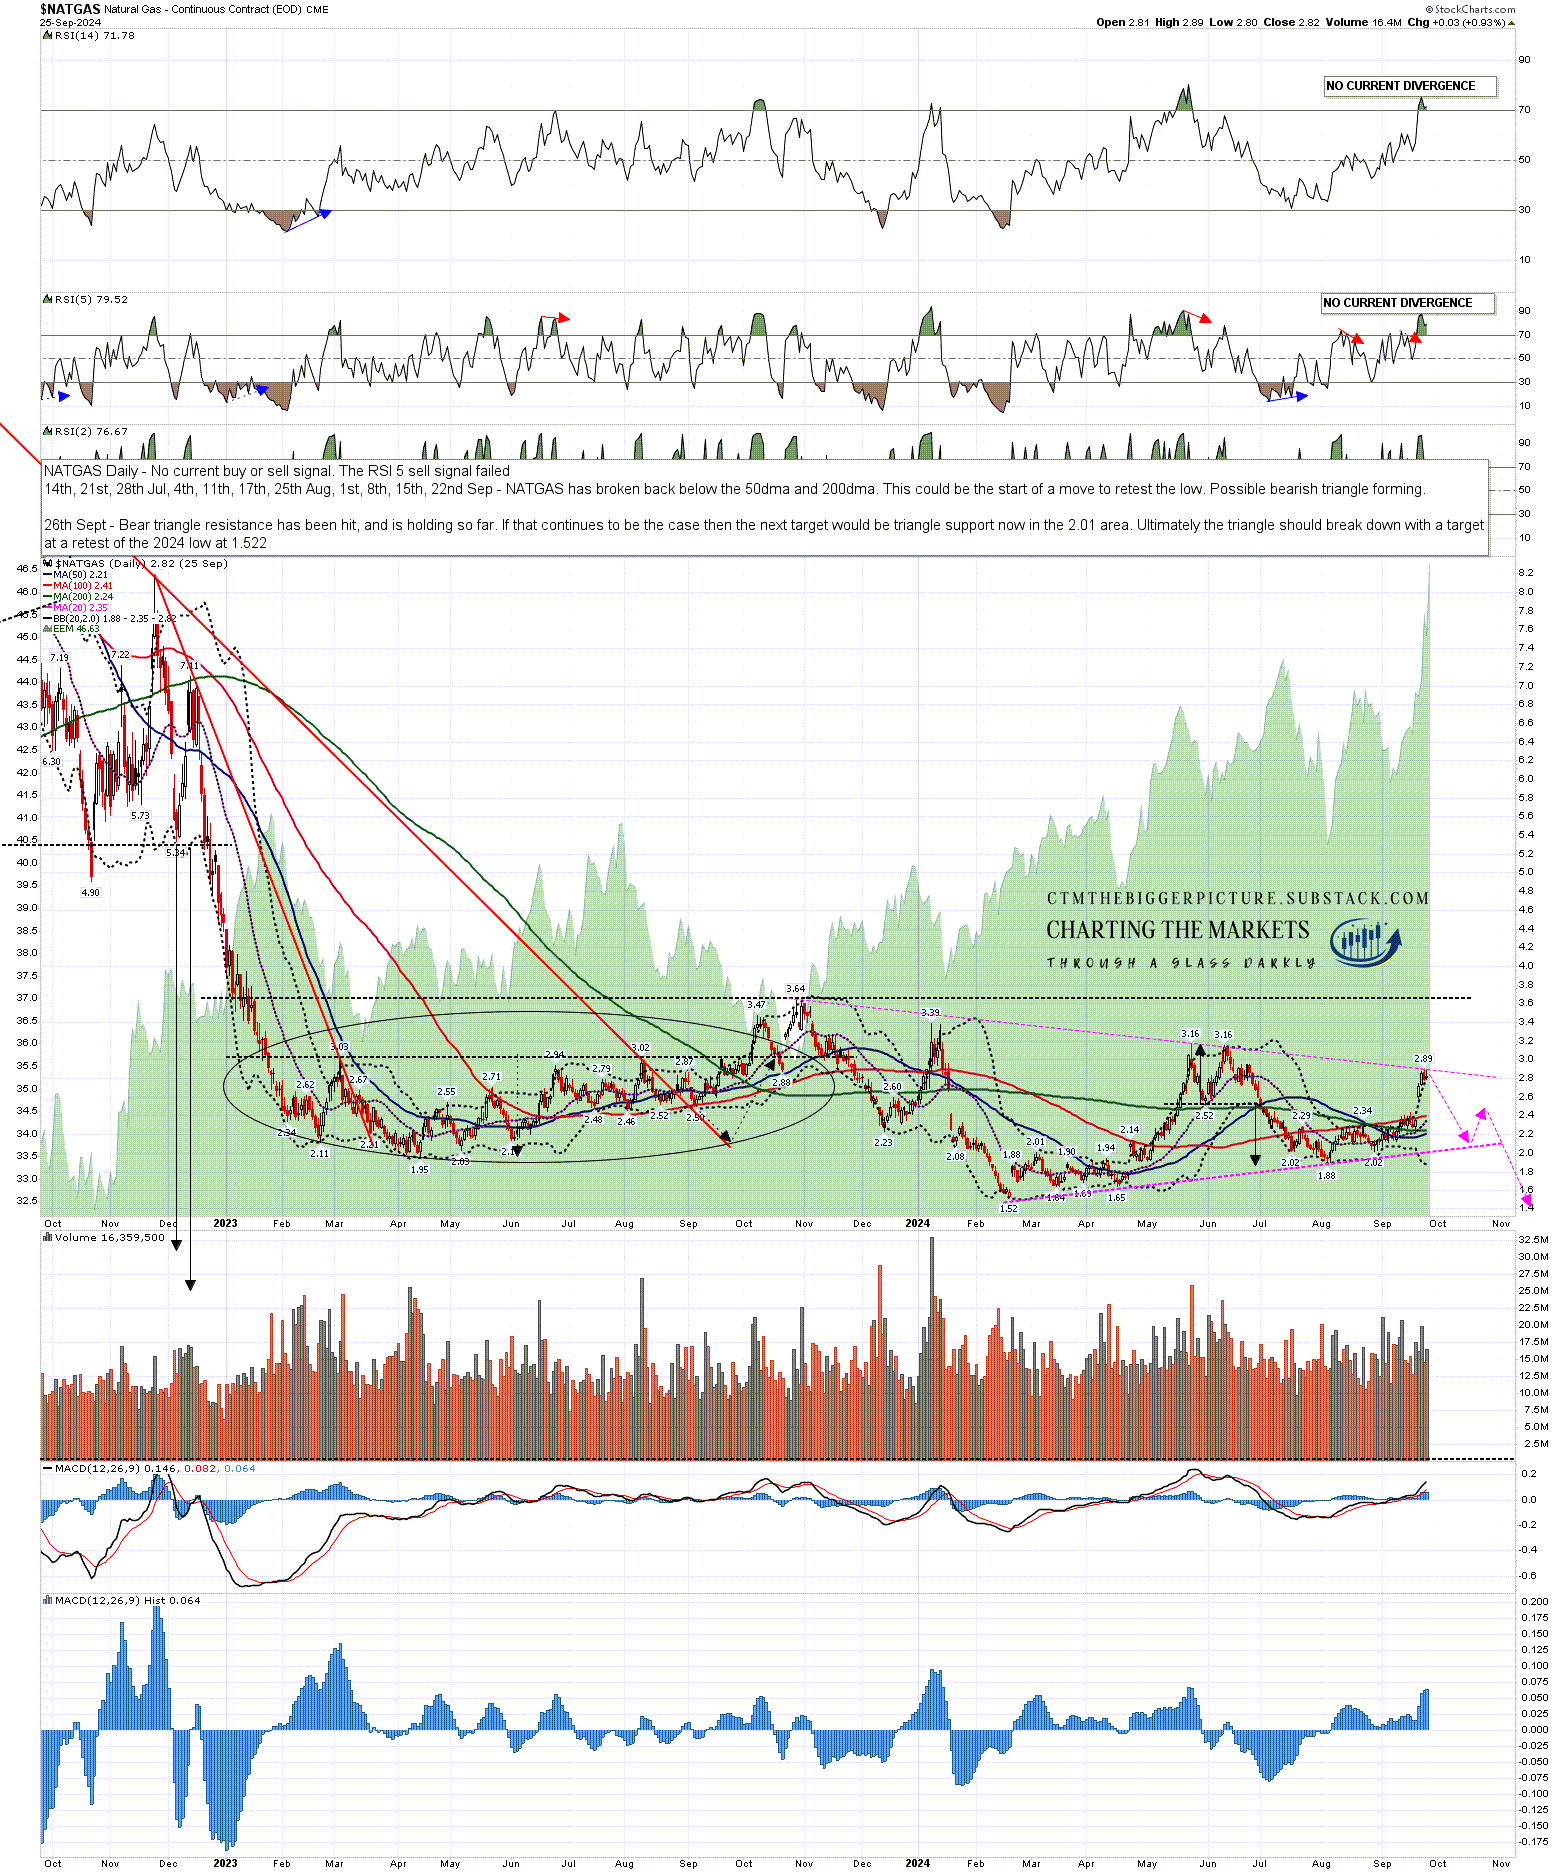
While oil was breaking down natural gas traded sideways, and when oil started to rally at the start of December, natural gas headed towards triangle resistance, hitting that at 2.89 and that is holding so far. If that continues to hold then the next obvious moves would be a move to triangle support, currently in the 2.01 area, then a partial fifth wave rally back up to perhaps the 2.5 area, then a break down from there with a target at a retest of the February 2024 low at 1.52. I’ve marked the path on the chart below, though I wouldn’t read anything into the timing of those moves.
NATGAS daily chart:
So what’s happening on the bigger picture here? Well I think we may be watching a bottoming process for oil and natural gas from their 2022 highs. An ideal double bottom rallies about 50% from the low, then retests it before rejecting back up.
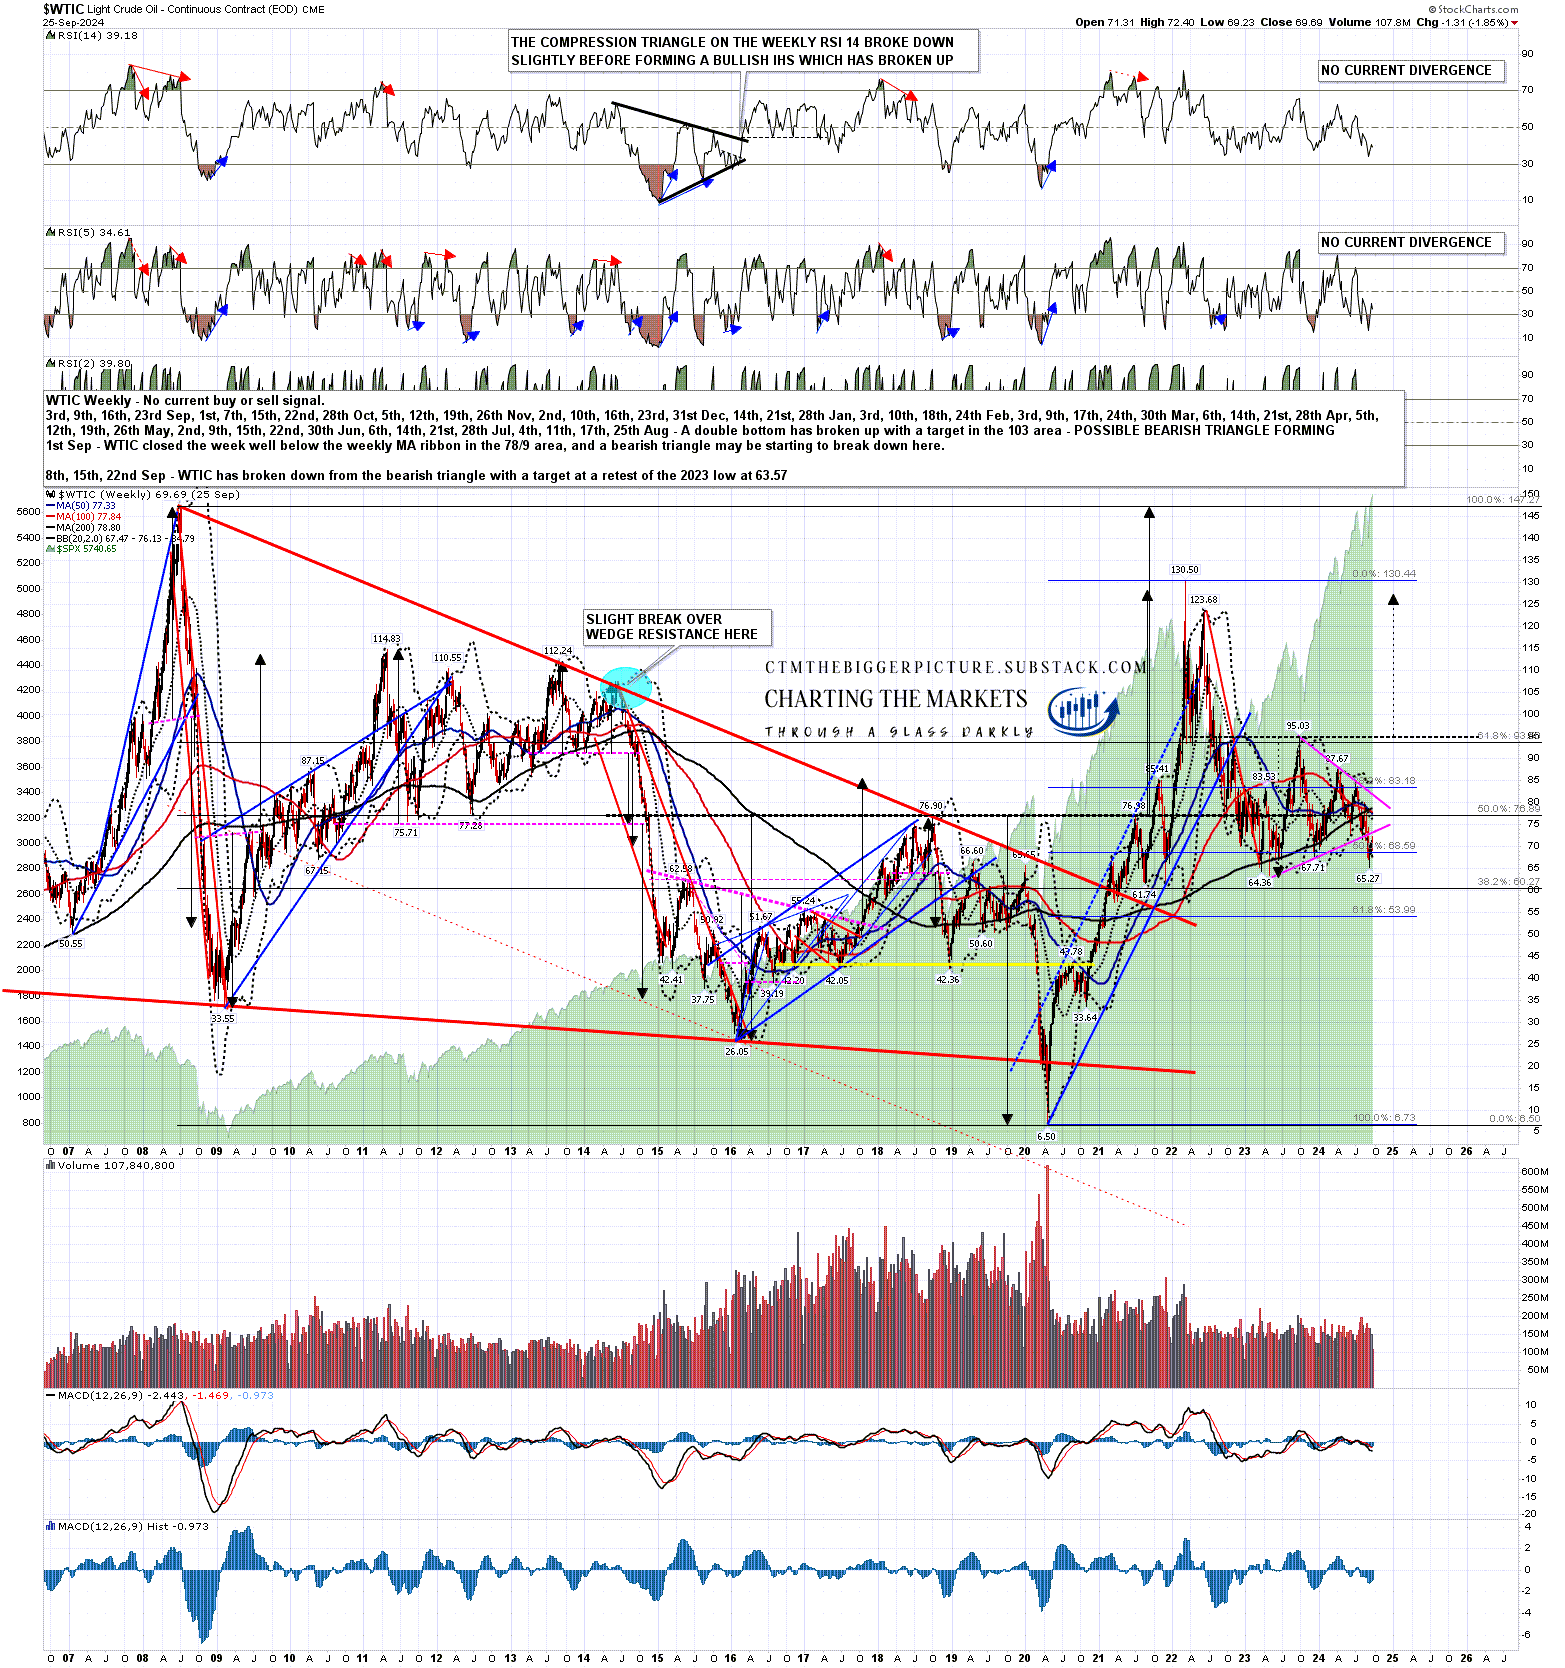
After the low at 63.57 in May 2023 oil rallied just under 50% of the decline from the 2022 high at 130.50 and looks likely to retest that low in the next few weeks. That will establish a possible double bottom setup that on a sustained break back up over 95.03 would look for a target most of the way back to the 2022 high at 130.50. That means that this current sequence may be setting up one of the most interesting long trade setups of the next couple of years.
WTIC weekly chart:
The bigger picture view looks a bit less exciting on natural gas where the possible low forming would be more modest in trend reversal terms, while natural gas is a much tougher trade because the monthly rolls between futures contracts can easily eat up even a large potential profit that takes a few months to deliver, but it’s still interesting.
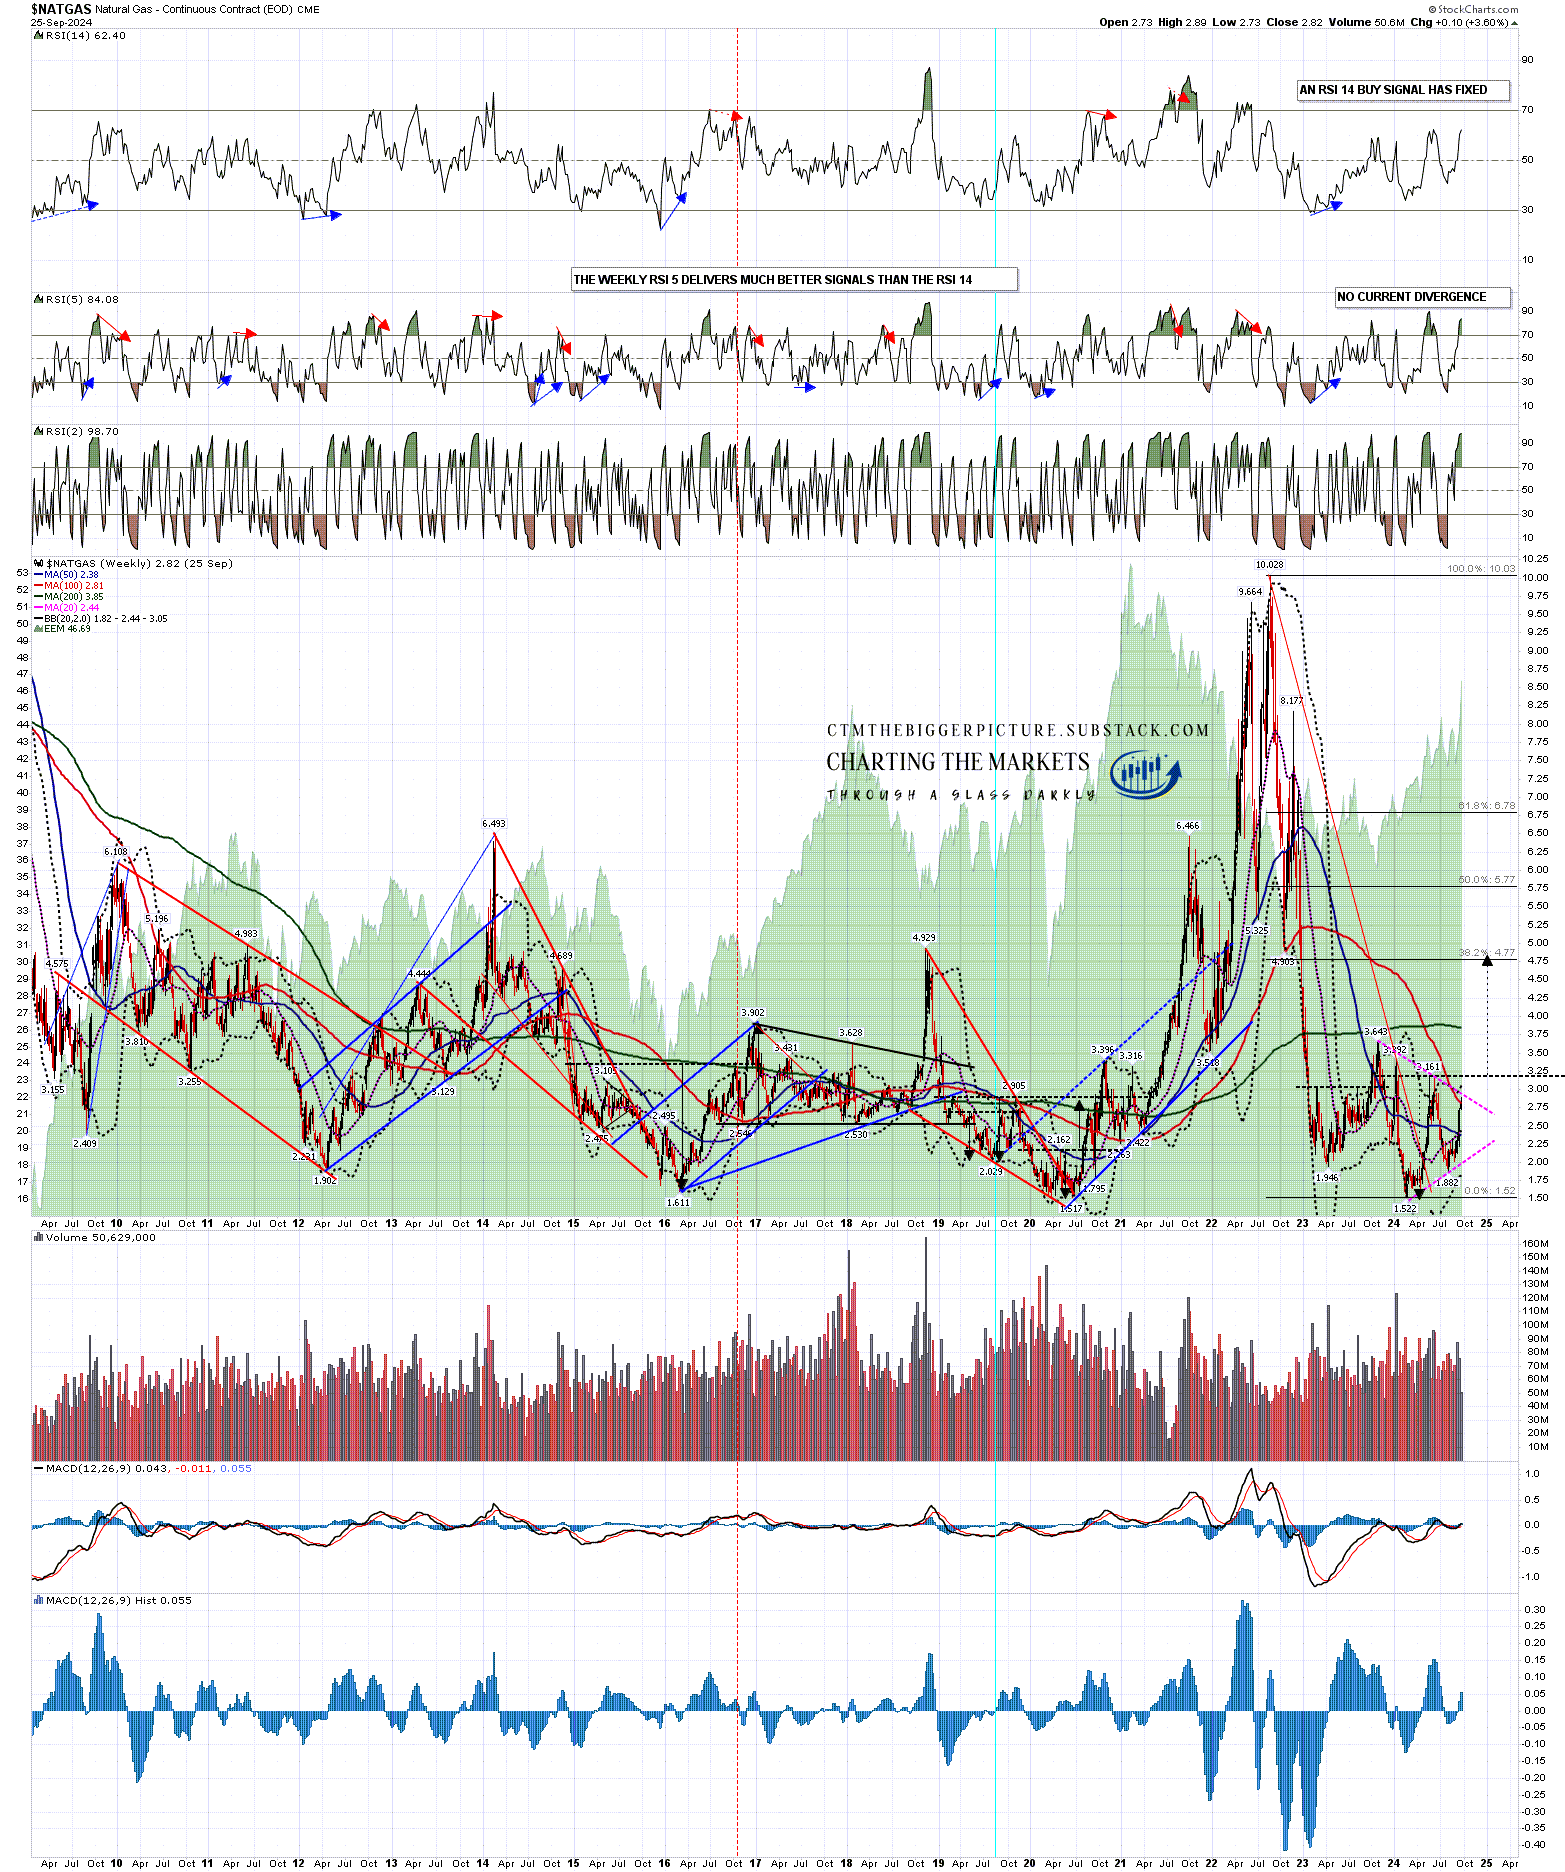
A retest of the February 2024 low at 1.52 would set up a possible double bottom with resistance at 3.16 and, on a sustained break over that, a target in the 4.80 area. That would get natural gas back close to a 38.2% retracement of the 2022-4 decline, which I have in the 4.77 area. That would be a more than triple the level of a low in the 1.52 area but, as I said, that is a much tougher trade though, if seen, I’ll certainly be fixing my domestic energy costs for a couple of years at that retest.
NATGAS weekly chart:
Could oil & gas retest those lows and then just continue down? Sure, though there is solid established support on oil in the 62-4 area, and even stronger long term support on natural gas in the 1.5 to 1.6 areas, in the case of natural gas a level unbroken since 1995 so, if seen, my lean would be towards making a low on both in those areas. We shall see.
If you like my analysis and would like to see more, please take a free subscription at my ctmthebiggerpicture substack, where I will be publishing my posts covering other than equities or crypto, and where I do my The Bigger Picture webinars on Sunday and Wednesday nights.
If you like my analysis and would like to see more of my work on equity indices, please take a free subscription at my chartingthemarkets substack, where I publish my equity index posts, and do a short general premarket review every morning.
If you like my analysis and would like to see more of my work on crypto, please take a free subscription at my ctmcrypto substack, where I publish my crypto posts, and do a short crypto premarket review every morning.
