Let’s start off with a simple fact: out of 100,000 people, you’ll find maybe one true bear among them. There’s hardly anyone that’s ever going to posit a bearish argument about the stock market, because they have no vested interest in doing so. Not the carnival barkers on CNBC. Not the equity-pushers from Goldman Sachs, And, God knows, never, ever from any Wall Street analyst. 365 days out of every year, their message is the same: “Buy, Buy, and Buy some more.”
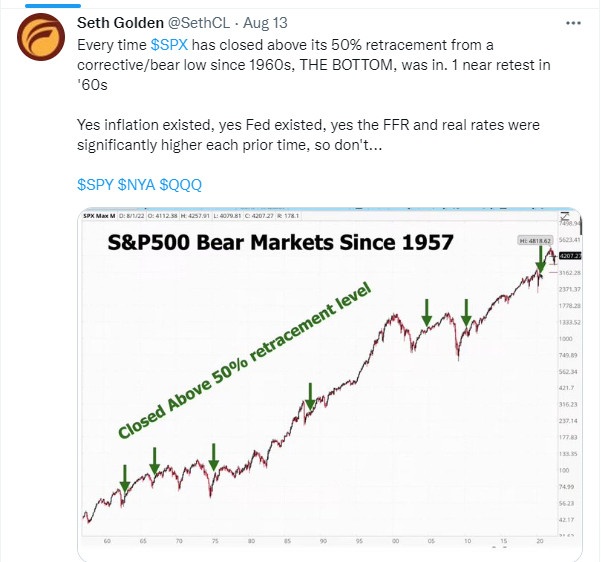
Thus, it is no surprise that we’re seeing a particular “fact‘ being pushed onto the public, stating in no uncertain terms that there has never been an instance in the history of the universe when a market has recovered more than 50% of its price plunge and failed to soar forward into a new bull market. I am seeing this argument absolutely slathered all over Twitter………..