
I have been a long time user of analogs. I like looking to history to see how it echoes back against us, again and again. I have studied the crash of 1929 and the Great Depression at length. As a result, when I see patterns in today’s market, they sometimes remind me of patterns that I have seen before in markets of the past.
I had that experience again yesterday and today with the chart below. I recognized that SPY this year has been acting a lot like INDU acted in 1929, but on a slightly different timeframe. The 1929 chart shows roughly six weeks of trading action. The SPY chart shows all of 2022 thus far. History books can tell you what happened next.
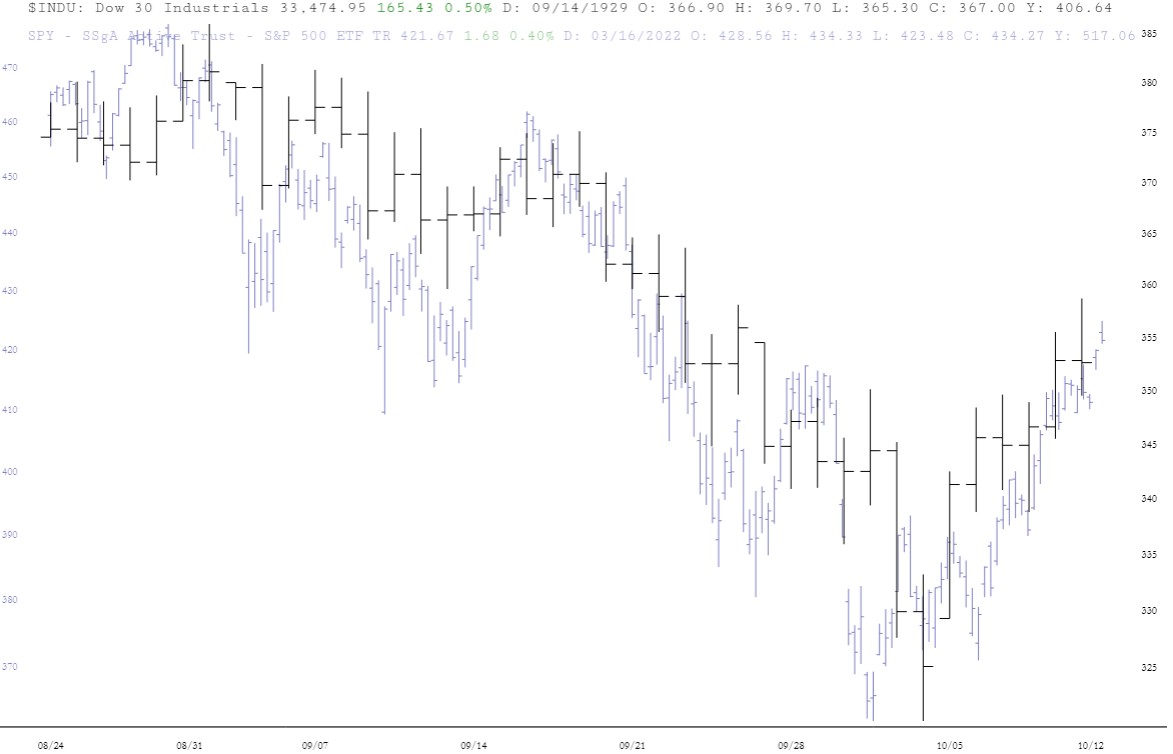
Will that happen again today? Sometimes analogs work, and give you valuable guidance of what is about to come next. Sometimes analogs fail at the exact moment when you are wanting them to work the most. This is, I believe, human nature intermingling with the analog. At either conclusion though, I think the analog can give you valuable guidance as to whether this scenario is continuing to transpire.
Something to be aware of. Nothing more. Nothing less.
