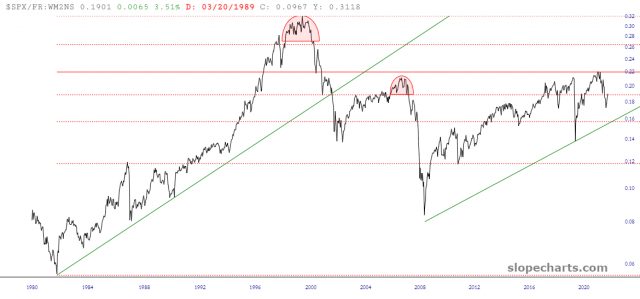
We haven’t looked at this fascinating ratio chart in a while, so let’s dust it off. This is the S&P 500 cash index divided by the M2 money supply. As a reminder, this is, to my way of thinking, a more honest reflection of the market’s value, since it is denominated by a “normalized’ dollar. Take careful note how, even in this laughably over-inflated market, we have never even come close to the peak of the true bullish prosperity of the late 1990s. We’re just been faking it for twenty-two years.
