Slope of Hope Blog Posts

Slope initially began as a blog, so this is where most of the website’s content resides. Here we have tens of thousands of posts dating back over a decade. These are listed in reverse chronological order. Click on any category icon below to see posts tagged with that particular subject, or click on a word in the category cloud on the right side of the screen for more specific choices.

Possible Retrace Here (by Springheel Jack)

By -

I've been running a lot of charts this morning and have narrowed the field down to ten I'd like to post today. That's rather too many, so I'll post five here and the rest on twitter later. 

On the SPX daily chart there was a clear break over resistance ant the middle bollinger band yesterday and that should be support on a closing basis today in the 1448 SPX area. The next target up is the upper bollinger band, currently at 1468, and that is the retest of the highs area that I was talking about yesterday. Barring a major reversal today that's what I'm expecting to see on Friday or Monday:

(more…)

SPX Breaks Rising Channel Support (by Springheel Jack)

By -

I won't include the SPX daily chart today as I posted the SPY equivalent yesterday in my weekend post at MarketShadows and you can see that here. What I have to add to that this morning is that I have had a close look at the current bollinger band setup back to the start of 2009, and have come up with the following stats:

  1. 9 instances – Touch and reversal or 2 day base at the lower bollinger band.
  2. 7 instances – A plunge through the lower bollinger band.
  3. 10 instances – Riding the lower bollinger band downwards as we are seeing at the moment. 
Of this last group of 10, which is the group of interest today, and we would now be starting day 4 as the first touch was on Wednesday, the outcomes were as follows:
  1. 2 instances – A low on the third day – short term bullish
  2. 6 instances – A low on the sixth or seventh day 20 to 70 points lower – short term bearish
  3. 2 instances – A low on the tenth day or later over 50 points lower – short term bearish

(more…)

Warning Signals (by Springheel Jack)

By -

I called my brother last weekend and told him that we might get an unexpected bearish breakdown this week or next week and that the QEX rally that almost everyone, including me, has been expecting might be delayed or even possibly cancelled. I was looking at the AAPL chart at the time, which I've been looking at a lot this week, and yesterday morning it looked as though the H&S there might fail. It hasn't though, and looks grimmer than ever after a perfect retest of the H&S neckline and failure of a small IHS from the low yesterday. This is an important chart and AAPL is big enough to move both the NDX and SPX significantly just as SPX is poised just above major support. I tweeted an hour ago that AAPL looks ready to bury short term and that is what it is from a technical viewpoint:

(more…)

Upside Targets (by Springheel Jack)

By -

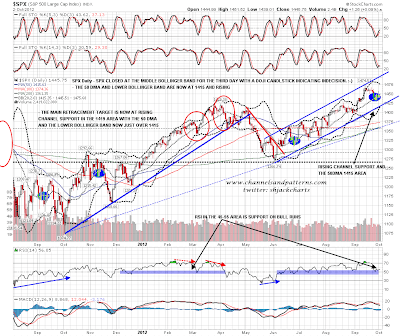
On the SPX daily chart yesterday we saw a clear break up from the middle bollinger band and the minimum target for that break is the upper bollinger band, which was at 1472 at the close yesterday. I'm expecting a retest of the highs and most likely another smaller retracement from there to test (and possibly break) SPX rising channel support, which was not hit on this retracement and is unfinished business below. That said the daily bollinger bands have pinched in, and historically that has generally led to a strong trending move that pushes the upper bollinger band up considerably. If we don't see a reversal in the 1470-80 SPX area, the upside target would therefore be at rising channel resistance in the 1500-20 area, which also has some longer term resistance that I will be talking about in detail if we see no reversal near the current 2012 high:

On the SPX 60min there is no current sign of a short term high and I'm expecting more upside:

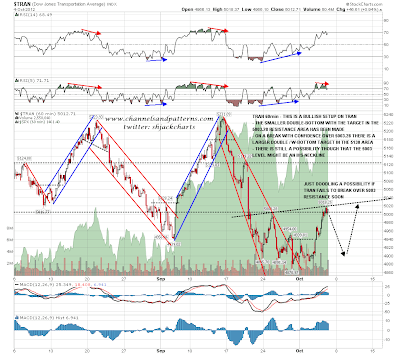
TRAN is still in a possible reversal area around 5003 resistance. On a break above with any confidence the upside target is 5130 area resistance but until then we could see a significant reversal here:

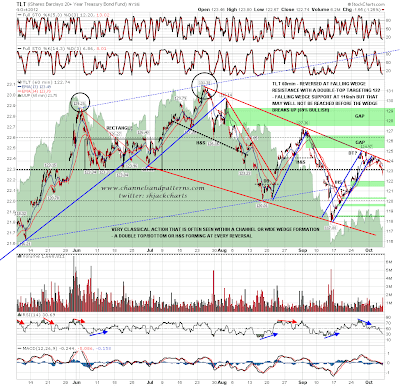
TLT has broken the small double-top trigger level with a target at 122. Falling wedge support is in the 116 area but the wedge has three touches each side now and that support may not be reached before the wedge (69% bullish) breaks up. This is another reason why I think we may see more retracement from the 1470-80 SPX area:

I was talking about the bull case on CL yesterday and there was a very nice bounce there. I have a likely target for this move in the 93.3 – 93.7 area but short term CL will need to break up from the possible declining channel on the chart below. I'm expecting that to break but I'll be happier about more upside on CL once we see an hourly close over it:

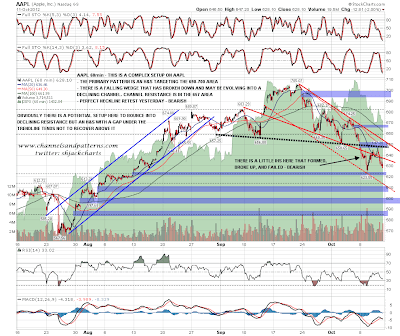
In fundamental terms EURUSD looks very unattractive, but short term that doesn't mean a lot. In technical terms there is a very nice bull setup here with the IHS targeting the 1.313 area and a probable retest of the highs around 1.317. There is also now a strong support trendline in the 1.288 area and the bear case on EURUSD would only start to look slightly interesting on a break below that. Rising support from the low is now at 1.2725 and if that breaks then EURUSD would most likely retest the lows. Until then though, the highest probability path on EURUSD here is currently upwards:

I haven't time to post a gold chart today but I've mentioned regularly that the 1800 resistance level is a likely area to see a strong retracement. That is still my view and historically gold tends to decline in October. The chances are that will happen this year too. That is another reason to think that SPX may have more consolidation ahead as gold and equities are strongly correlated at the moment. We'll see how that goes. 

For today I have a strong resistance level on ES at 1462, and an hourly close above should clear the path for a SPX to reach the upper bollinger band and retest the current highs. ES is testing that level now and if we see some early weakness today, it would most likely be from there. 

I'm taking a long weekend to see some old friends and won't be around much today. 

Waiting for a Break (by Springheel Jack)

By -

Nothing much happened yesterday. SPX delivered an indecision doji on the daily chart that closed at the middle bollinger band for the third straight day, and TLT, TRAN and NDX all essentially traded sideways. There is quite a bit of potentially market-moving news today with the ADP Employment report at 8.30, the ISM Non-Manufacturing Index at 10, and an ECB meeting today. These ECB meetings have been pretty bullish lately, but with the Germans backpedaling in recent days on their earlier support for the ECB's statements that whatever was required to stabilize the Euro would be done, up to and including unlimited money printing by the ECB and direct support of stricken Euro members and their banks, the outcome of that meeting could well be bearish:

(more…)