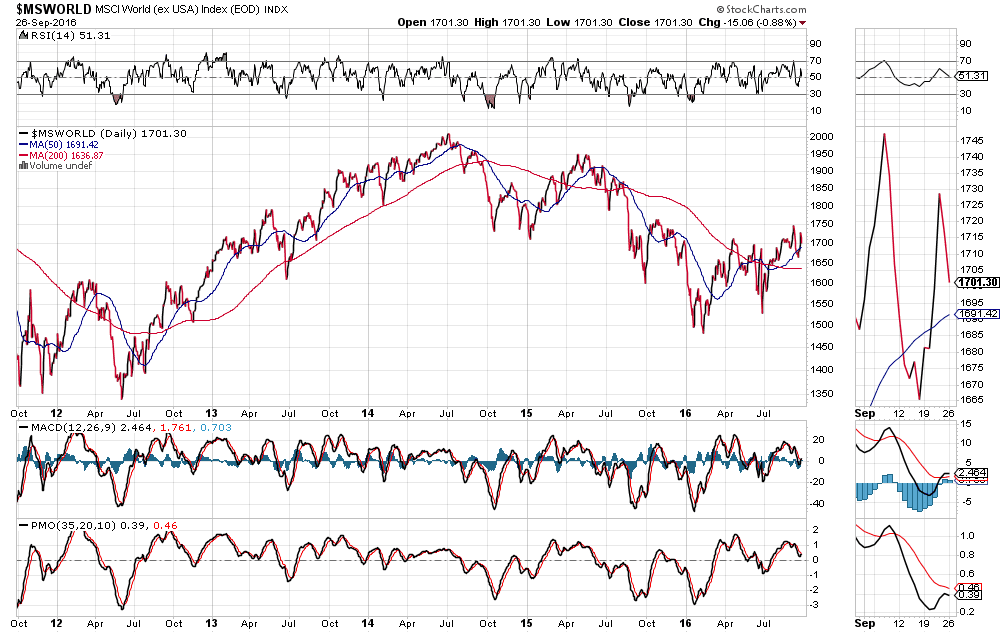
All three indicators on this 5-Year Daily chart of the World Market Index are slightly above their respective zero levels, with price hovering above the 50 moving average. They’ll all need to hold at or above those levels, otherwise a sharp failure would likely spell big problems for U.S. equities.