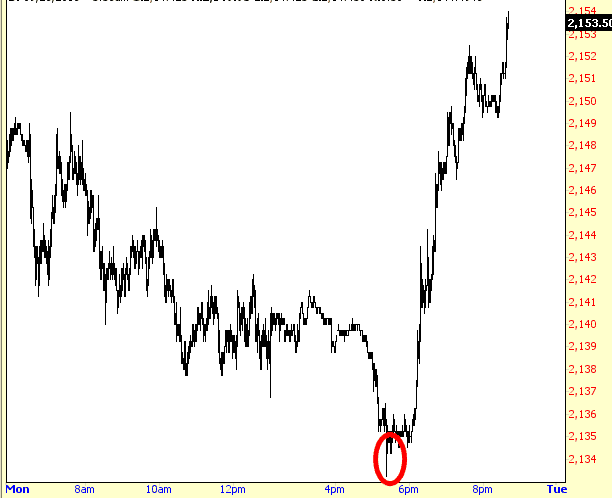
Well, that was embarrassing. Within about 4 minutes of the debate starting, I figured it was all over for Trump. By about the minute #20, I shut off the television. I just couldn’t take it anymore. If you want a quick rundown, here are top ten memorable moments. As for me, I think the last meaningful chance for a real sell-off in the market disappeared with this debate, and as the ES plainly shows, the market considers President Pantsuit the hands-down winner. Three cheers for the status quote and another term for Obama. She’s going to win.
Slope of Hope Blog Posts
Slope initially began as a blog, so this is where most of the website’s content resides. Here we have tens of thousands of posts dating back over a decade. These are listed in reverse chronological order. Click on any category icon below to see posts tagged with that particular subject, or click on a word in the category cloud on the right side of the screen for more specific choices.
One and Done
Yikes. I think he’s toast at this point. I couldn’t watch it past the first twenty minutes. I was live-tweeting from my iPhone on my sofa, and this pretty much tells the tale:
The ES zoomed 8 points higher based on his performance so far (from a -5 deficit to over +3 now). It’s a shame. I guess Obama gets a third term after all. This debate – – at least the first 20 minutes that I could tolerate – – was just embarrassing.
It Begins
Retracement Targets
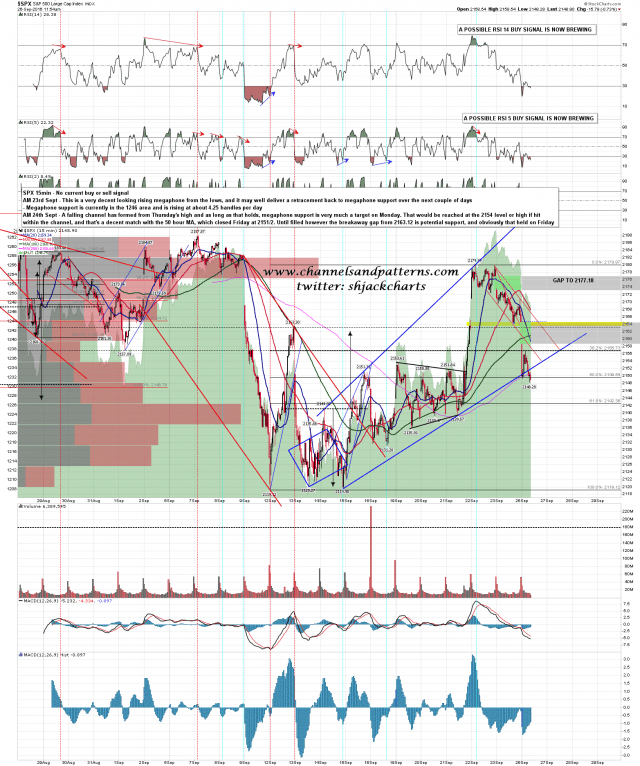
SPX closed Friday at a decent looking support level but when I was looking at the SPX, RUT & NDX charts over the weekend it was pretty obvious that the bulls were going to have their work cut out for them today. Below are the SPX and RUT charts I posted for Trader Chart Service subscribers at theartofchart.net yesterday. I haven’t changed the text but price has been updated and I’ve removed the gap that was filled on SPX at the open this morning.
You can see that SPX has broken below the rising megaphone support that I was looking at as a target on Friday morning. SPX 15min chart:
BoJ, FOMC and Where to Now?
Below is the opening segment of the September 25 edition of Notes From the Rabbit Hole, NFTRH 414…
The Bank of Japan gave us a glimpse as to just how far down the rabbit hole we may have to follow global policy makers as we try to make sense of ever more complex and shall we say, innovative ‘tools’ being used in the effort to engineer individual economies and asset markets within the global financial system. BoJ announced it would conduct “JGB purchase operations” in order to “prevent the yield curve from deviating substantially from the current levels”.
The market initially interpreted this to mean BoJ stood in support of a rising yield curve, which would for example, help the banks (ref. MTU and SMFG, which exploded higher off of the support levels we had projected), but by the end of the week the Japanese Yield Curve had eased substantially and there seemed to be confusion about what the policy’s intent, or would-be effects, actually were. I wonder if the BoJ even fully knows what it is doing now. Lots of moving parts in a complex system.


