
We saw the break down to a lower low as I was expecting in the premarket video yesterday, and found support and reversed there as I suspected might happen, as the potential rising channel on TF that I was looking at before the open was established. So where did that leave the indices at the end of the day?
RUT was the strongest and broke over resistance at the 50 hour MA and daily middle band into a high testing the 50dma. That break over the middle band needs a confirming close above it again today. SPX fell away from resistance at both 50 hour MA and daily middle band. NDX was the most bearish, falling away from 50 hour MA resistance and closing marginally below the daily middle band, which had been strong support Thursday through Monday. That break under the middle band needs a confirming close under it again today.
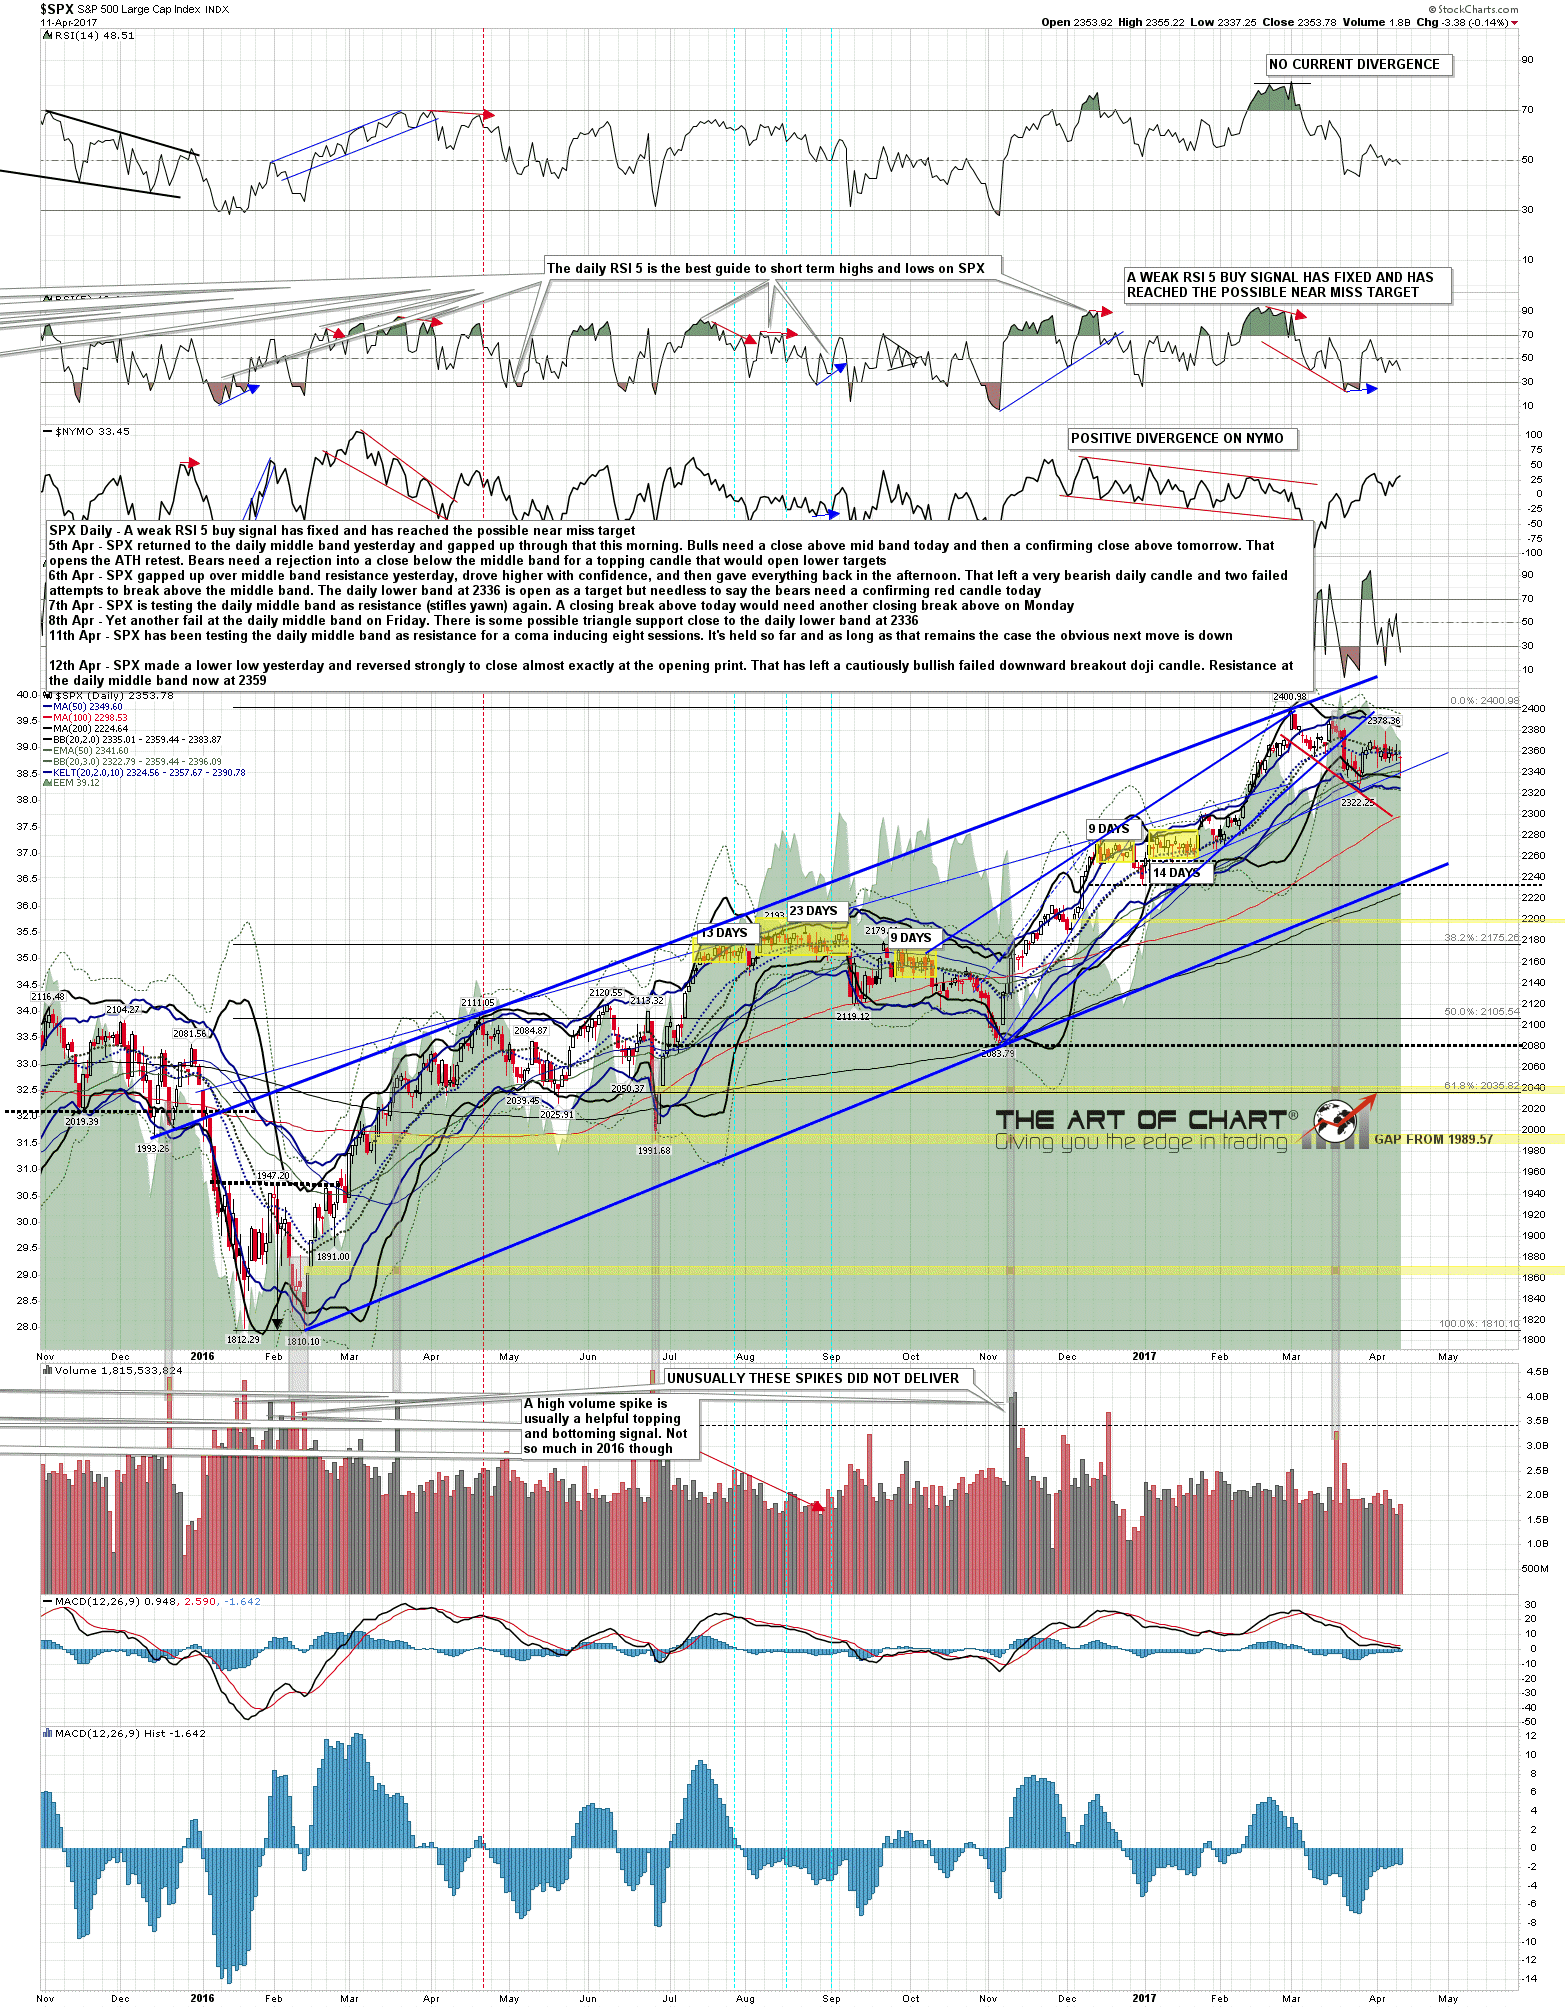
Resistance on the SPX daily chart is at the daily middle band at 2359 and support is at the daily middle band at 2335. SPX daily chart:
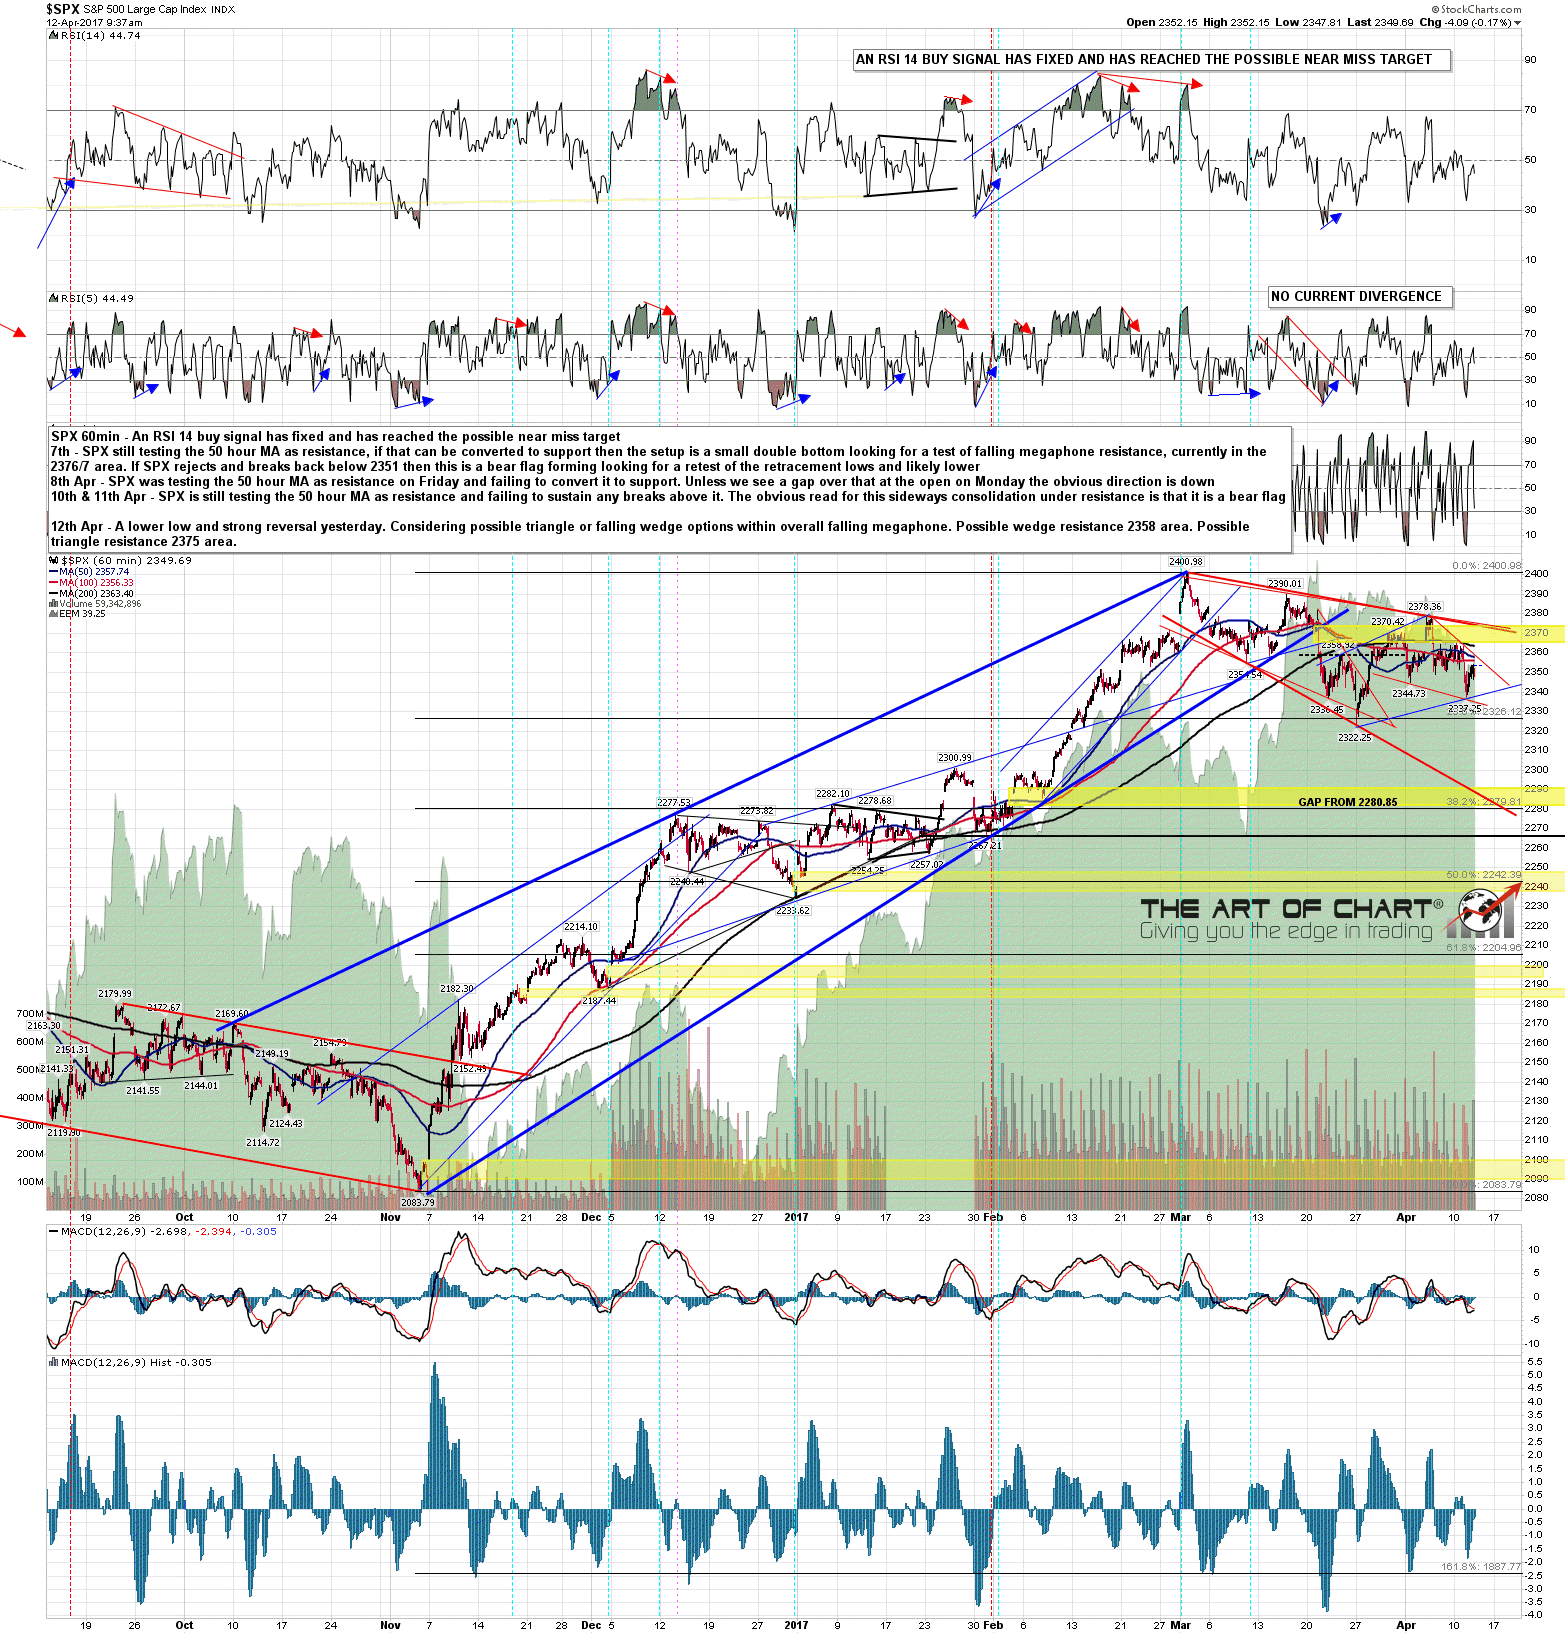
I’m considering possible falling wedge or triangle options on SPX 60min within the overall falling megaphone. The wedge has already been established overnight on the ES chart. Resistance at the 50 hour MA is at 2358, just under the daily middle band. SPX 60min chart:
The futures charts below were produced premarket for Daily Video Service subscribers at theartofchart.net. 30 day free trials are available here.
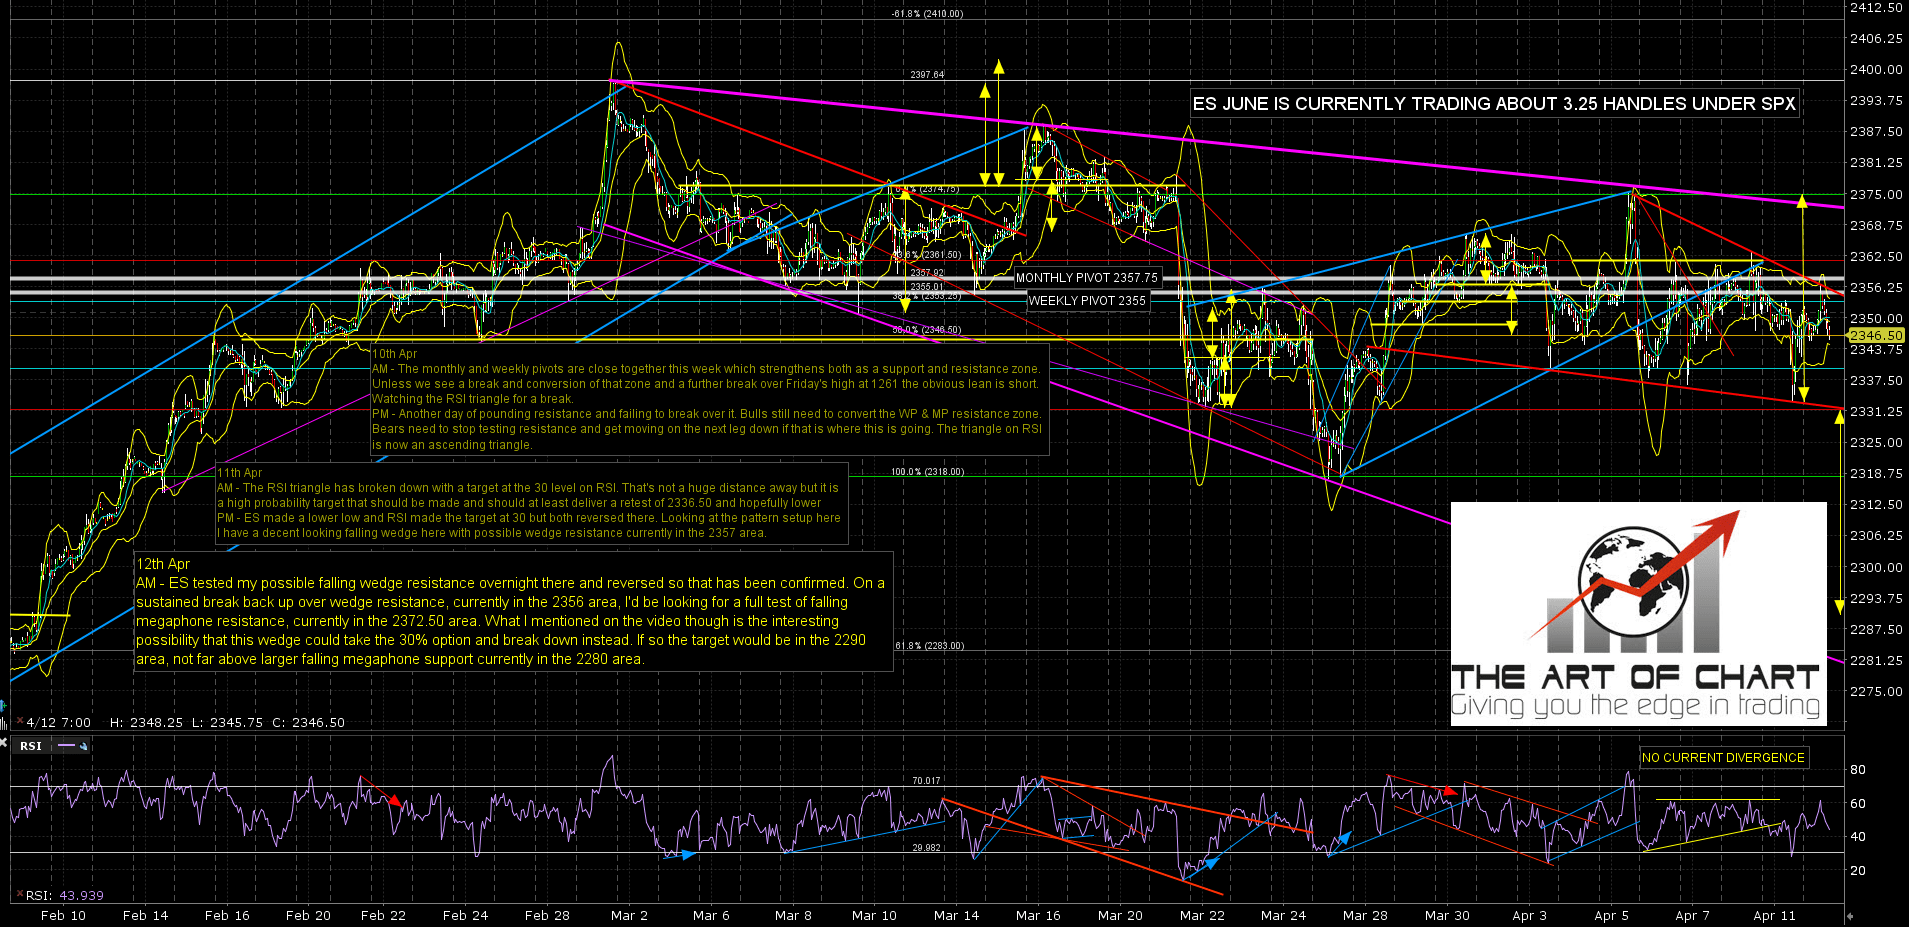
On last night’s chart for subscribers at theartofchart.net I was looking at possible falling wedge resistance in the 2357 area overnight and that trendline was confirmed at the globex high. The next obvious target would be wedge support currently at 2332, and on a break higher I’d expect a test of falling megaphone resistance currently in the 2372.5 area. What is potentially interesting with cycle trend days today and tomorrow is the possibility that the falling wedge might take the 30% option and break down rather than up. The target in that case would be in the 2290 area, not far above falling megaphone support currently in the 2280-2 area. ES Jun 60min chart:
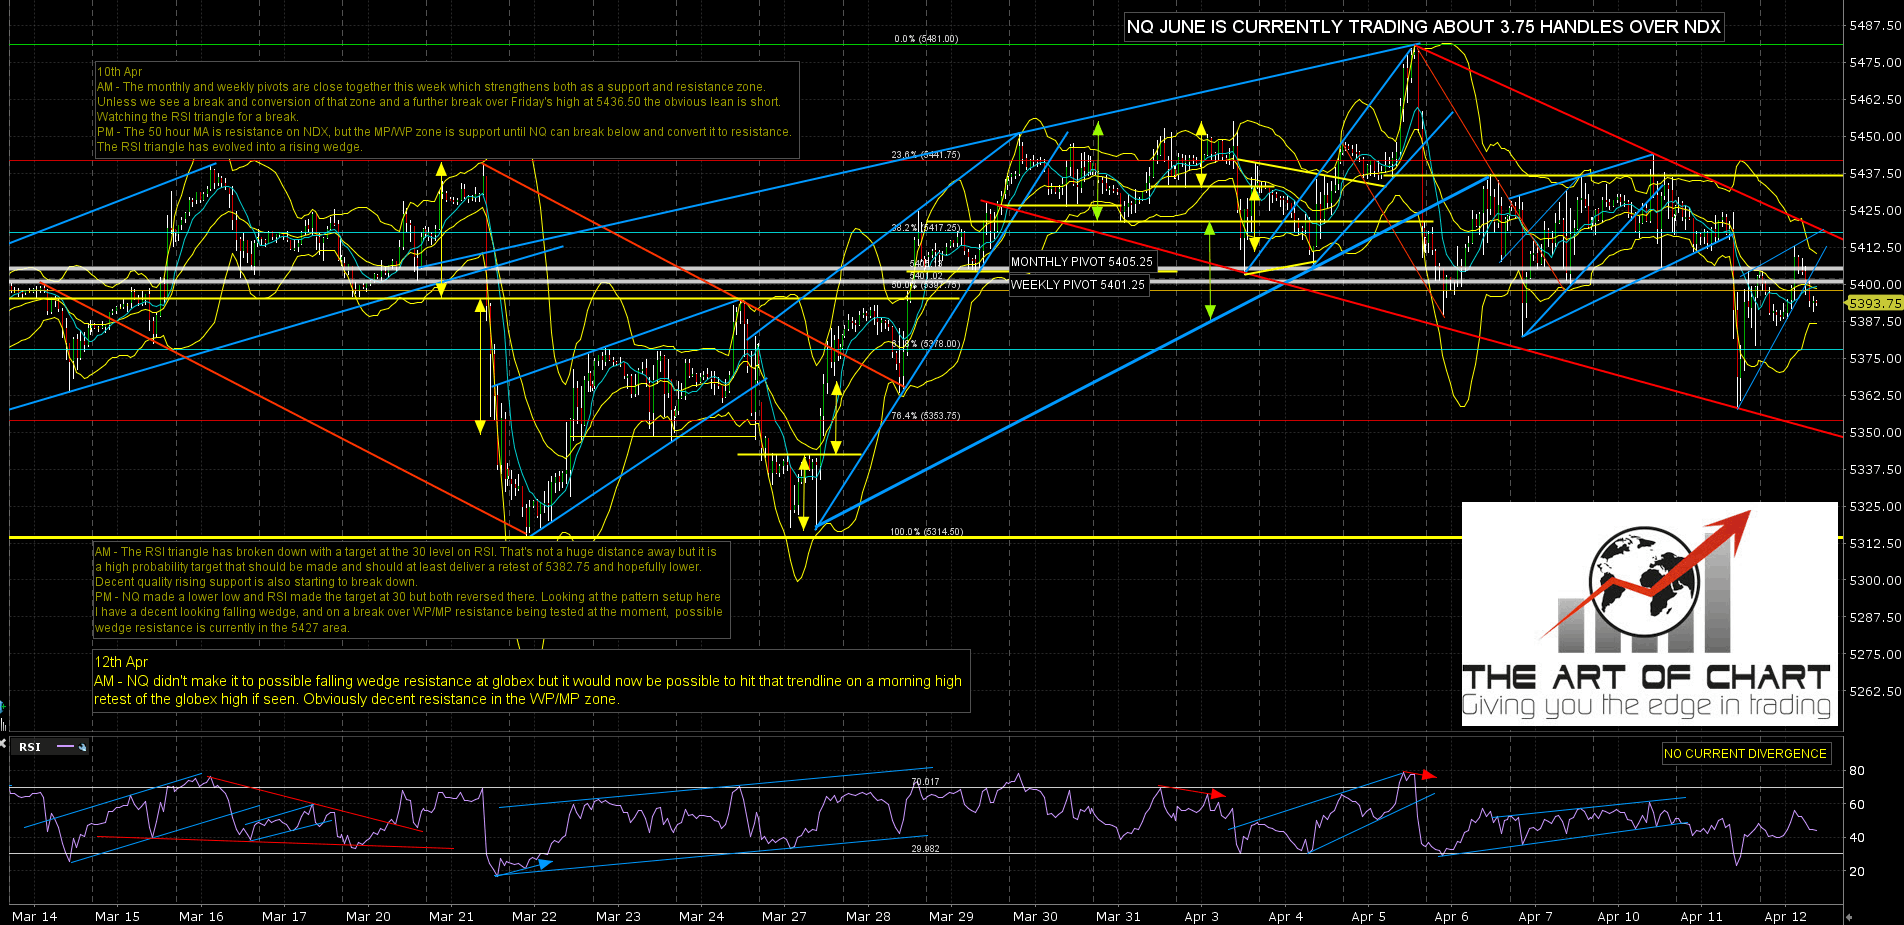
NQ held the weekly and monthly pivot resistance zone overnight and as long as that remains the case the obvious path is down. NQ Jun 60min chart:
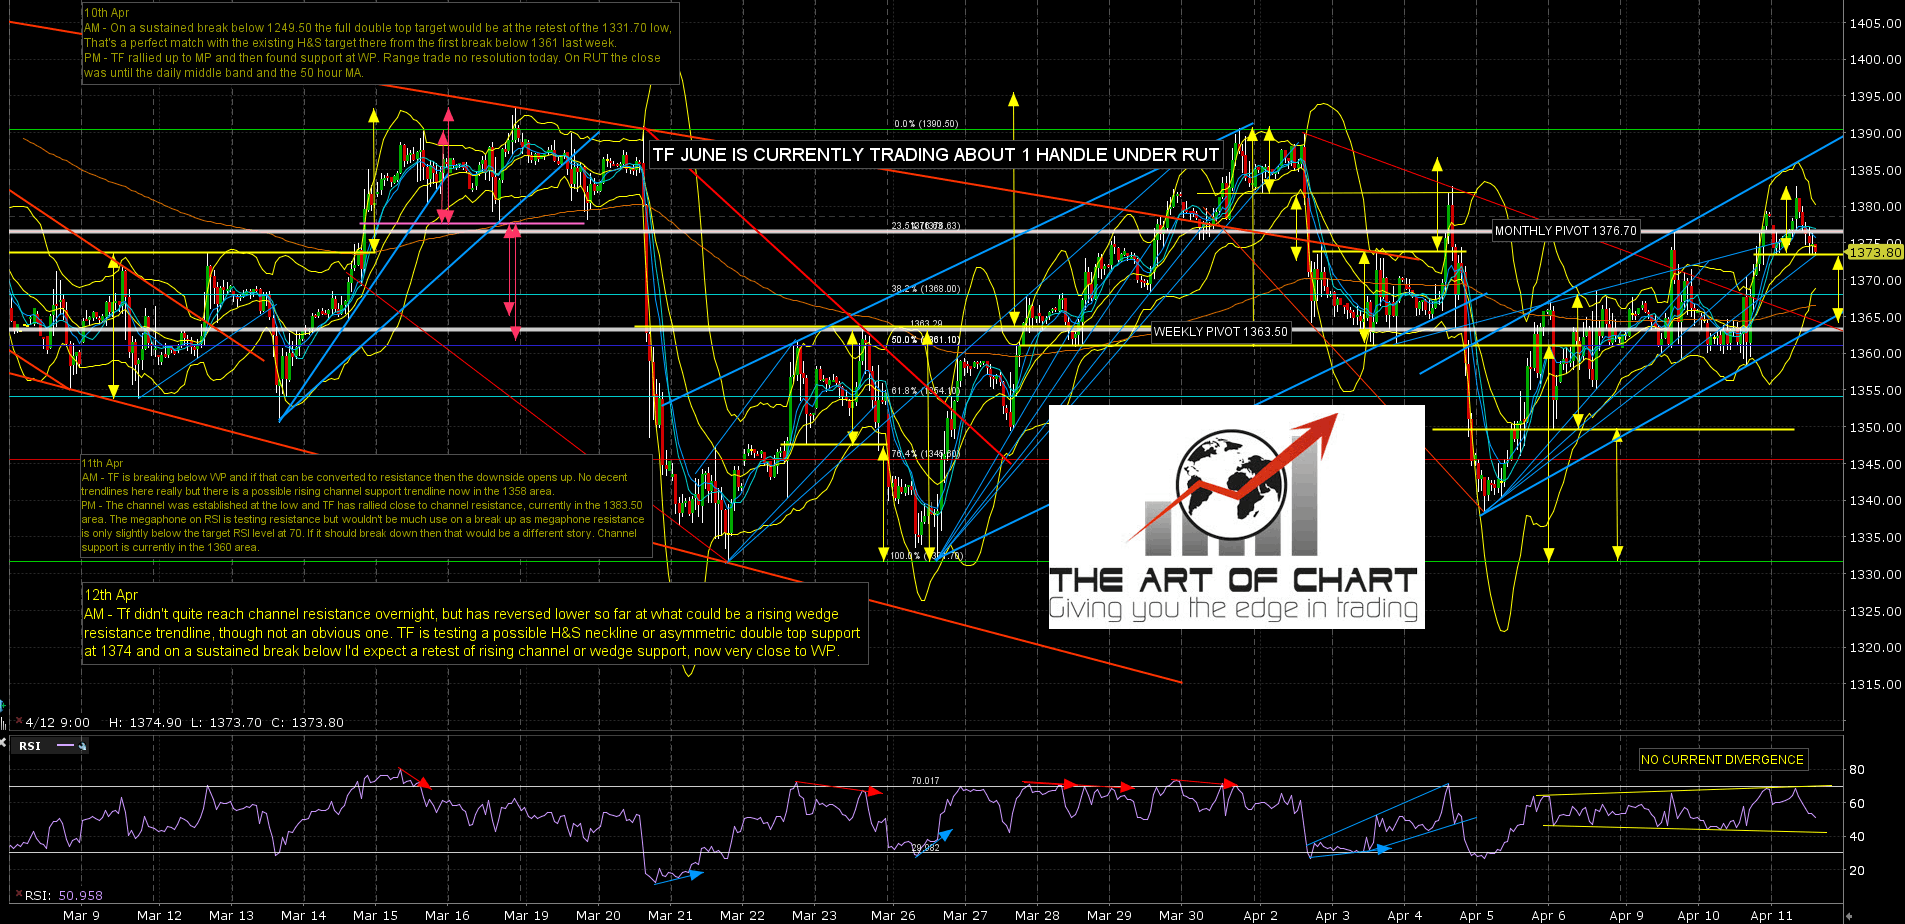
TF may again hold the key today, with a globex high that may be evolving the rising channel into a 70% bearish rising wedge. A small double top has broken down with a target at a retest of rising channel or wedge support, currently in the 1364 area. A test or break of that support trendline would confirm the rising wedge. TF Jun 60min chart:
As long as ES and NQ fail to convert the strong weekly and monthly pivot zones above the obvious lean is short. If they manage to convert these to support we could see a short squeeze. Bears really need a trend down day to do some damage, with the holiday weekend approaching and the stats for next week leaning strongly bullish. We’ll see what they can manage today.
Stan and I are doing a free public webinar after the close tomorrow on our Big 5 stocks, which are AMZN, AAPL, FB, NFLX and TSLA. If you’d like to attend you can sign up for that here.
