
All the new weekly pivots are on the daily charts posted below.
The last few days I have been watching the resistance at the daily middle band on all three of BTCUSD (Bitcoin), ETHUSD (Ethereum) and SOLUSD (Solana). An H&S pattern had formed and broken down on Solana, and another was still forming on Ethereum. If resistance at those daily middle band held then the setup was likely to break down further, into targets of 119 on Solana and 2,250 on Ethereum. On a sustained break up over those daily middle bands, and the failure of the H&S pattern on Solana on a break back up over the H&S right shoulder high at 152.17.
I posted an inflection point on Avalanche on my twitter on Wednesday last week on Avalanche, with a nice touch of an over falling wedge resistance and a well formed bear flag, and both broke up later that day. I did wonder then if that was a sign that the others would break up as well, and they all did on Thursday and Friday.
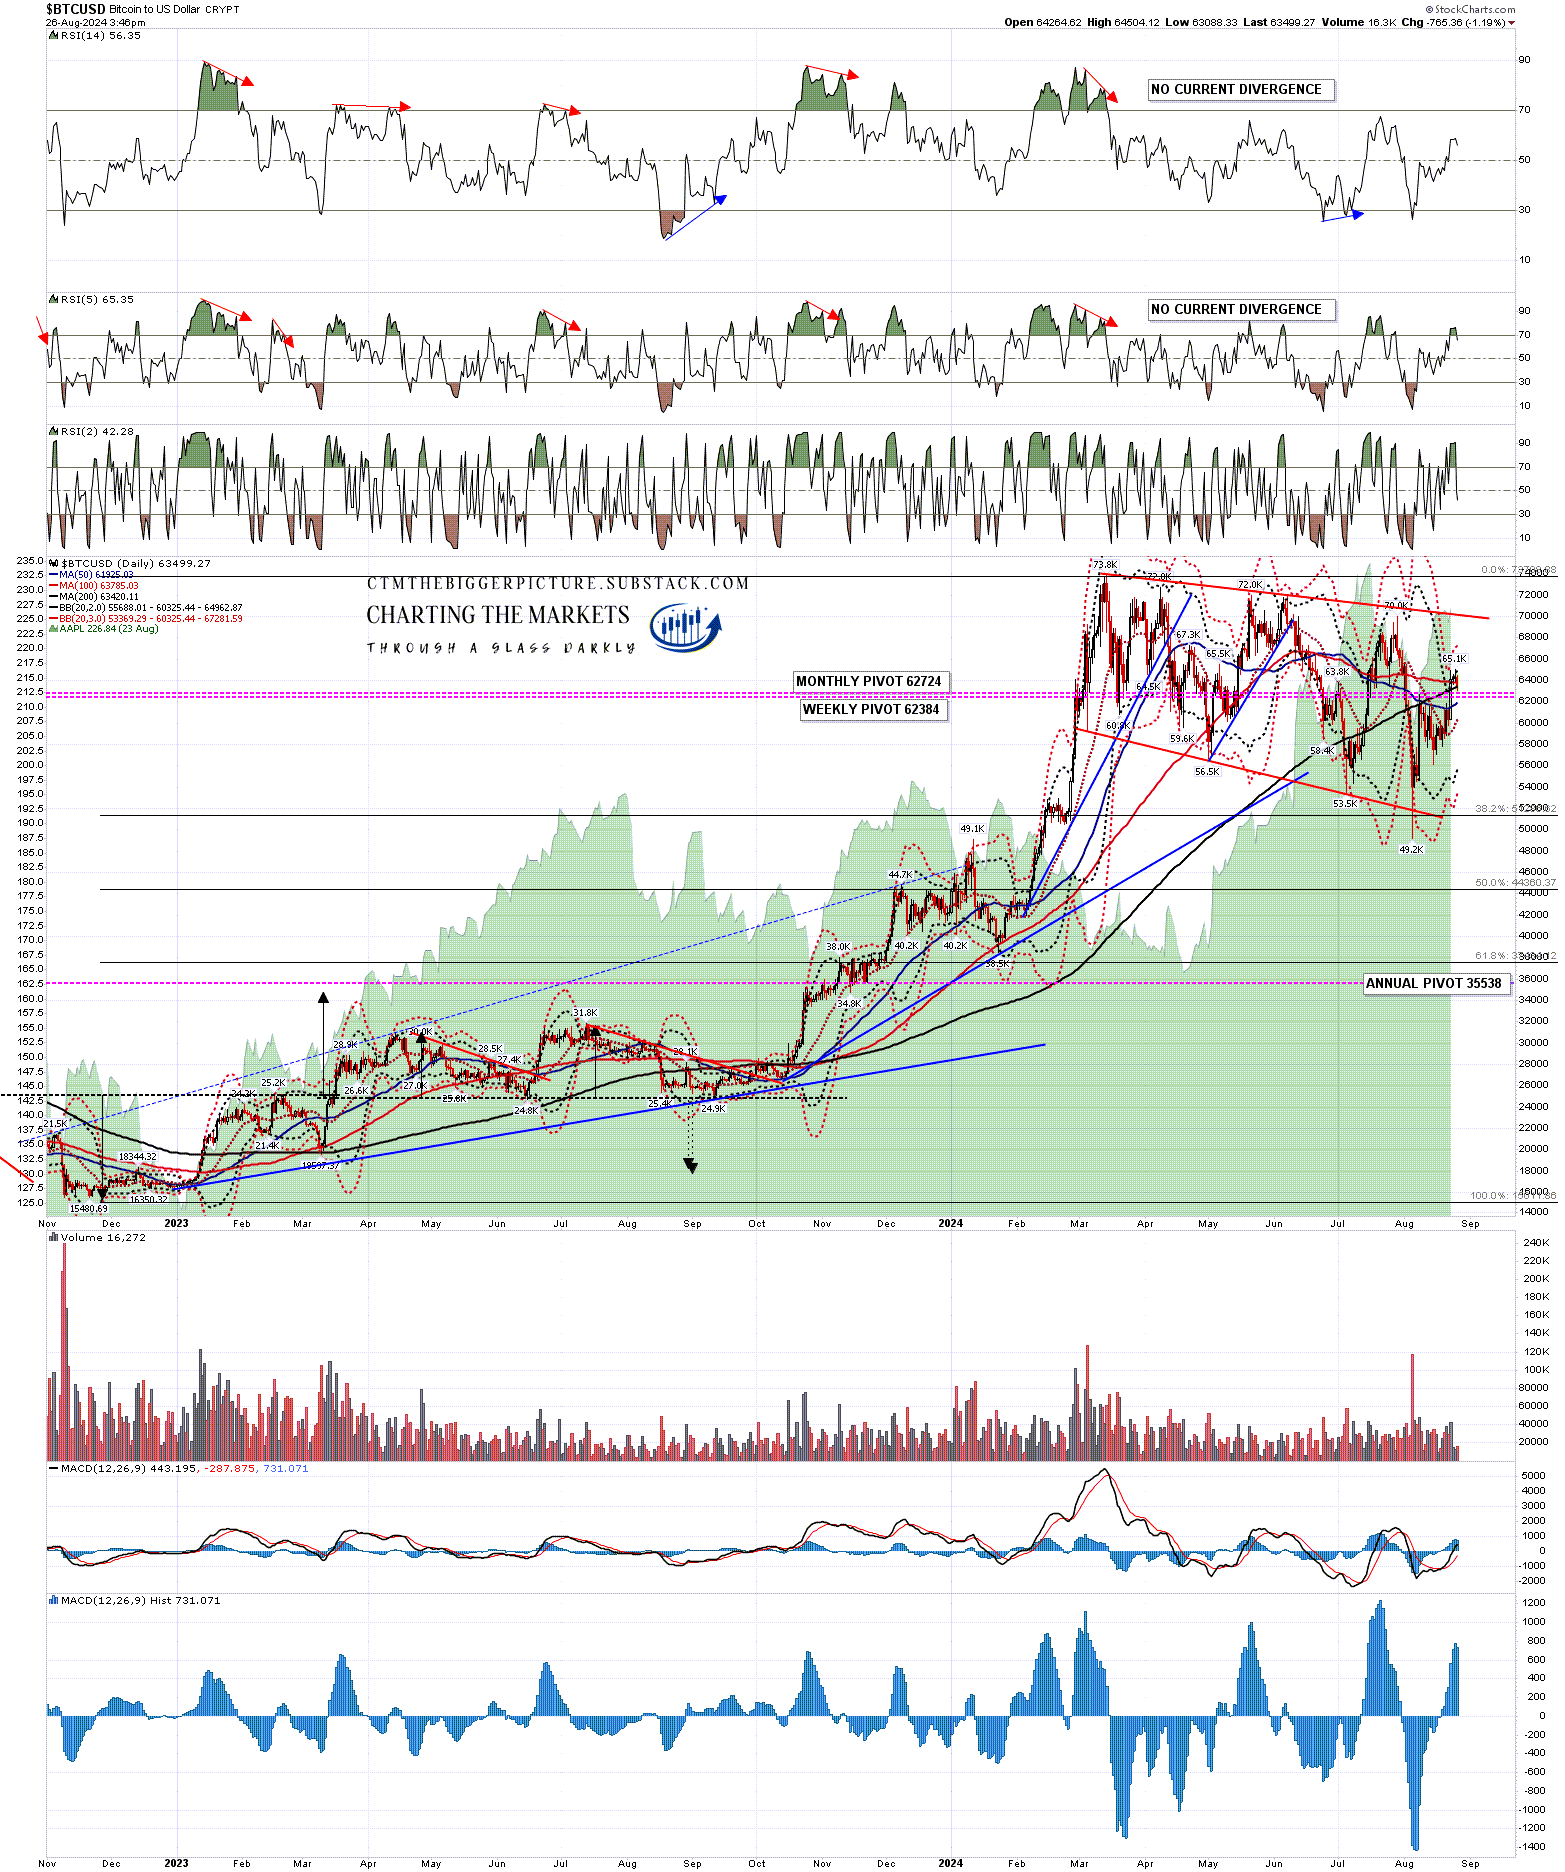
On Bitcoin there has been a clear and sustained break over the daily middle band, now at 60,325, then the 50dma, now at 61,925, with Bitcoin currently converting broken resistance at the 200dma, now at 63,420. Above there is an obvious target at overall bull flag resistance now in the 70,000 area.
BTCUSD daily chart:
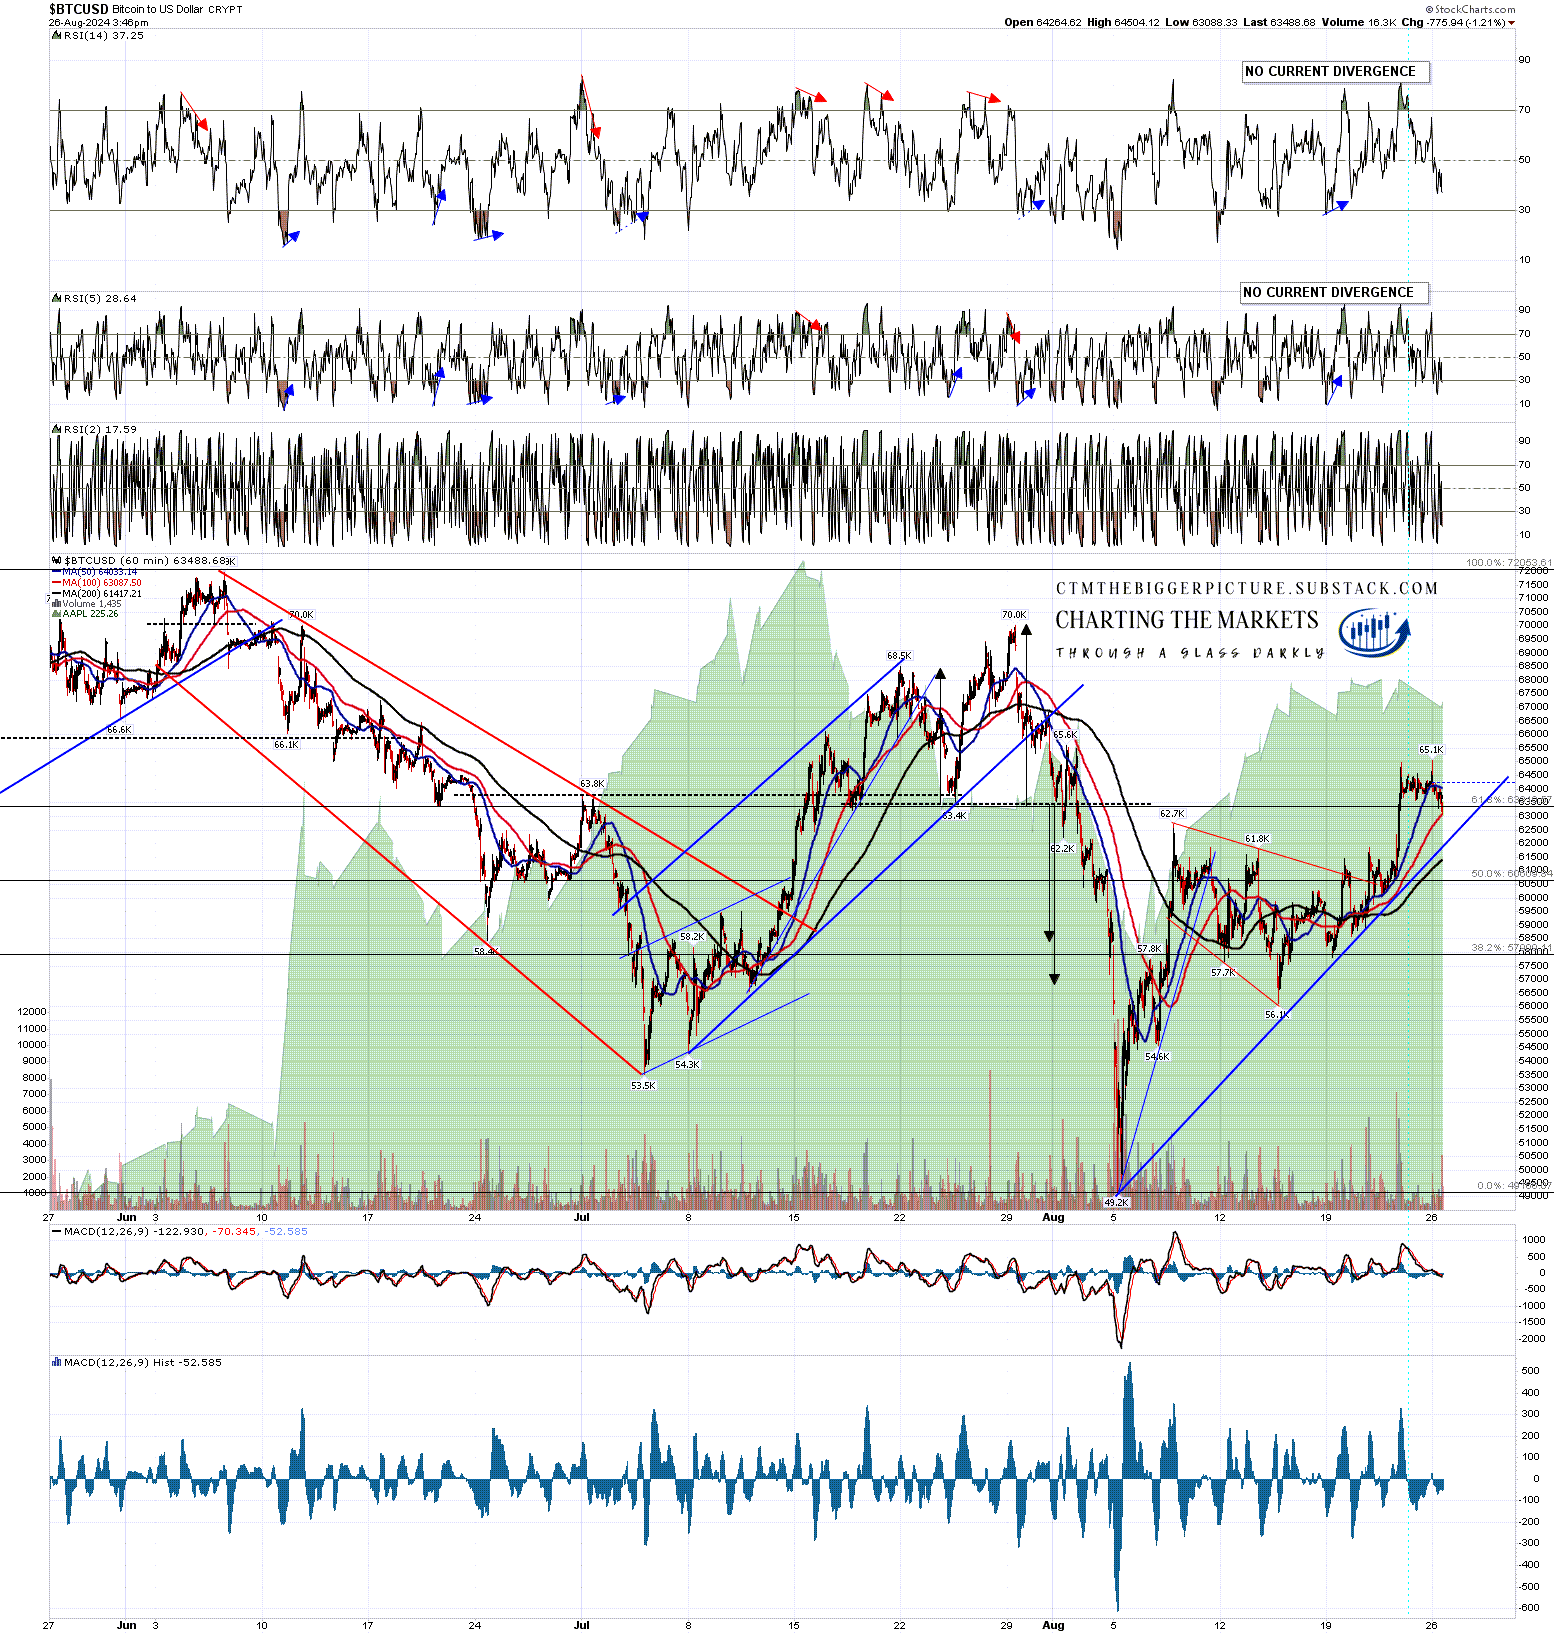
On the hourly chart Bitcoin has made the smaller bull flag target at 62.7k and the rising support trendline is now in the 62,000 area.
BTCUSD 60min chart:
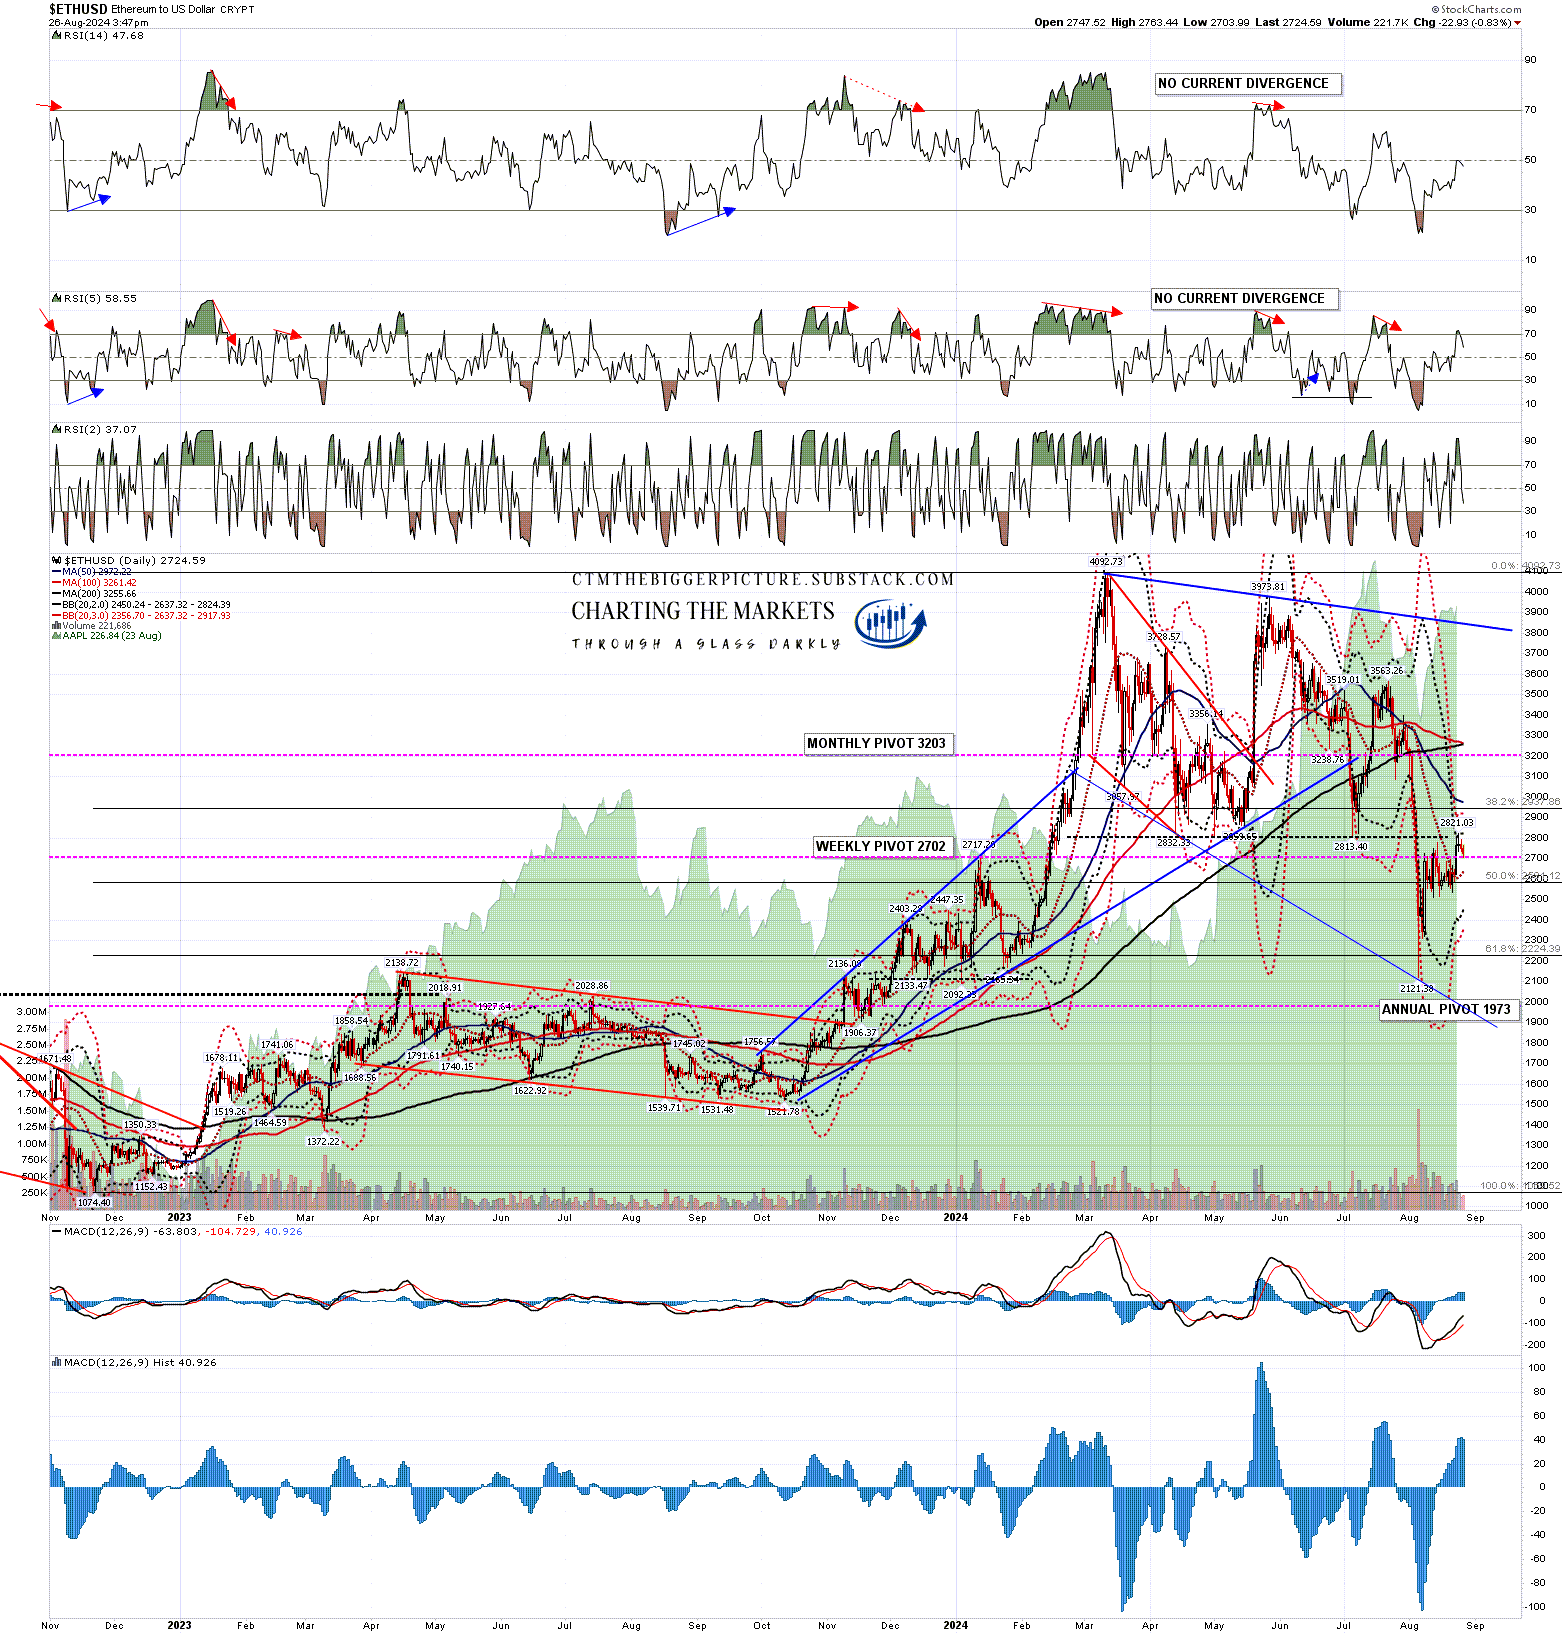
On Ethereum there has been another clear break over the daily middle band, now at 2,637, a retest of the prior short term high, and the obvious resistance above is at the 50dma, now at 2,972, and the 200dma, now at 3,255. On a sustained break above both the obvious next target would be at declining and possible bull flag resistance, now in the 3,850 area.
ETHUSD daily chart:
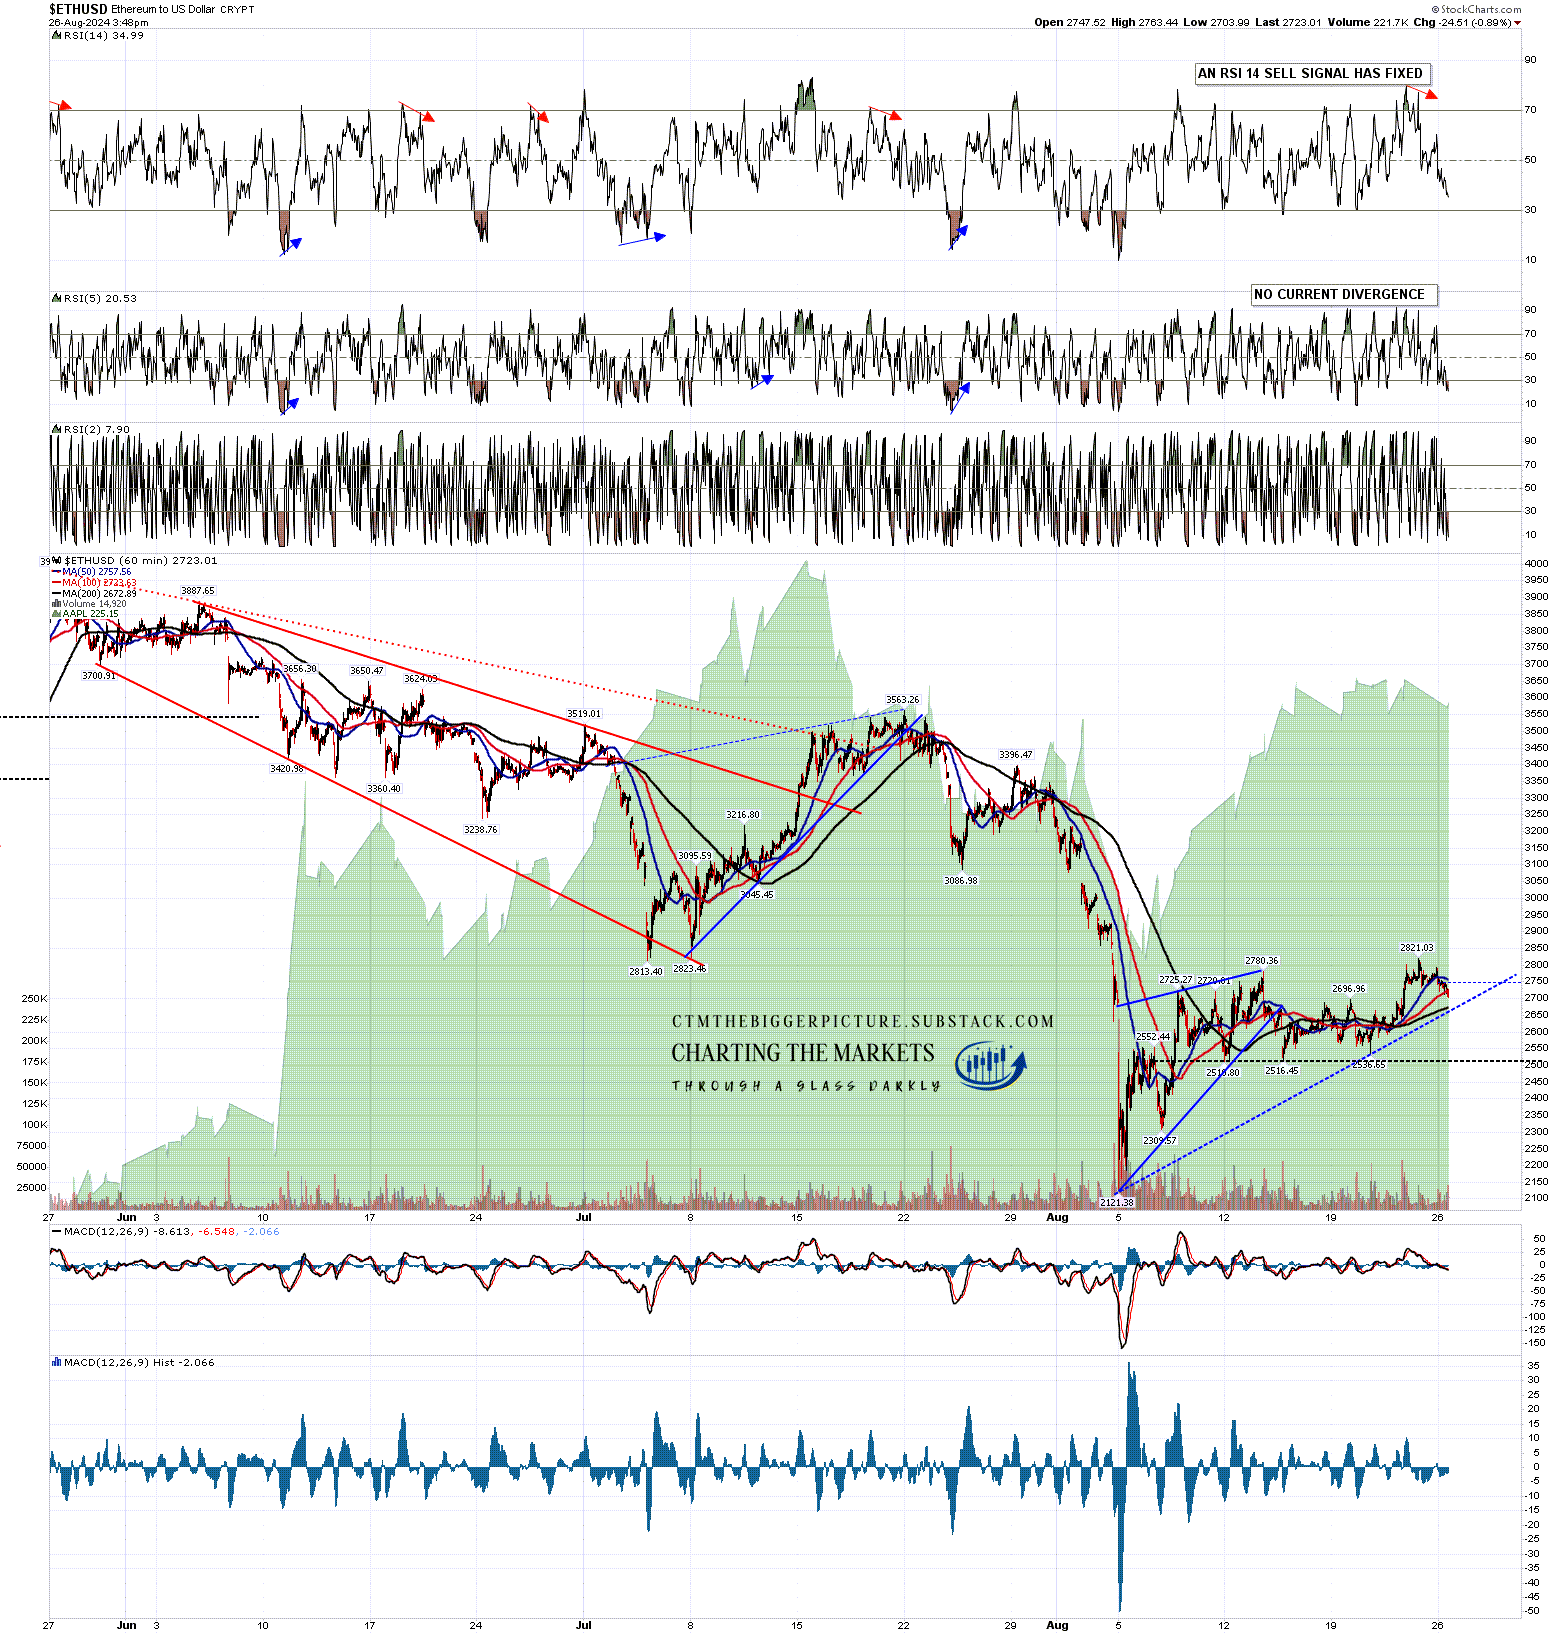
On the hourly chart the marginal higher high over 2780.36 still leaves a possible double top setup with double top support at 2,536.65. I’m not expecting this to deliver but I’ll be watching it until Ethereum kills the setup by going higher. In the short term an hourly RSI 14 sell signal has fixed but is already close to target.
ETHUSD 60min chart:
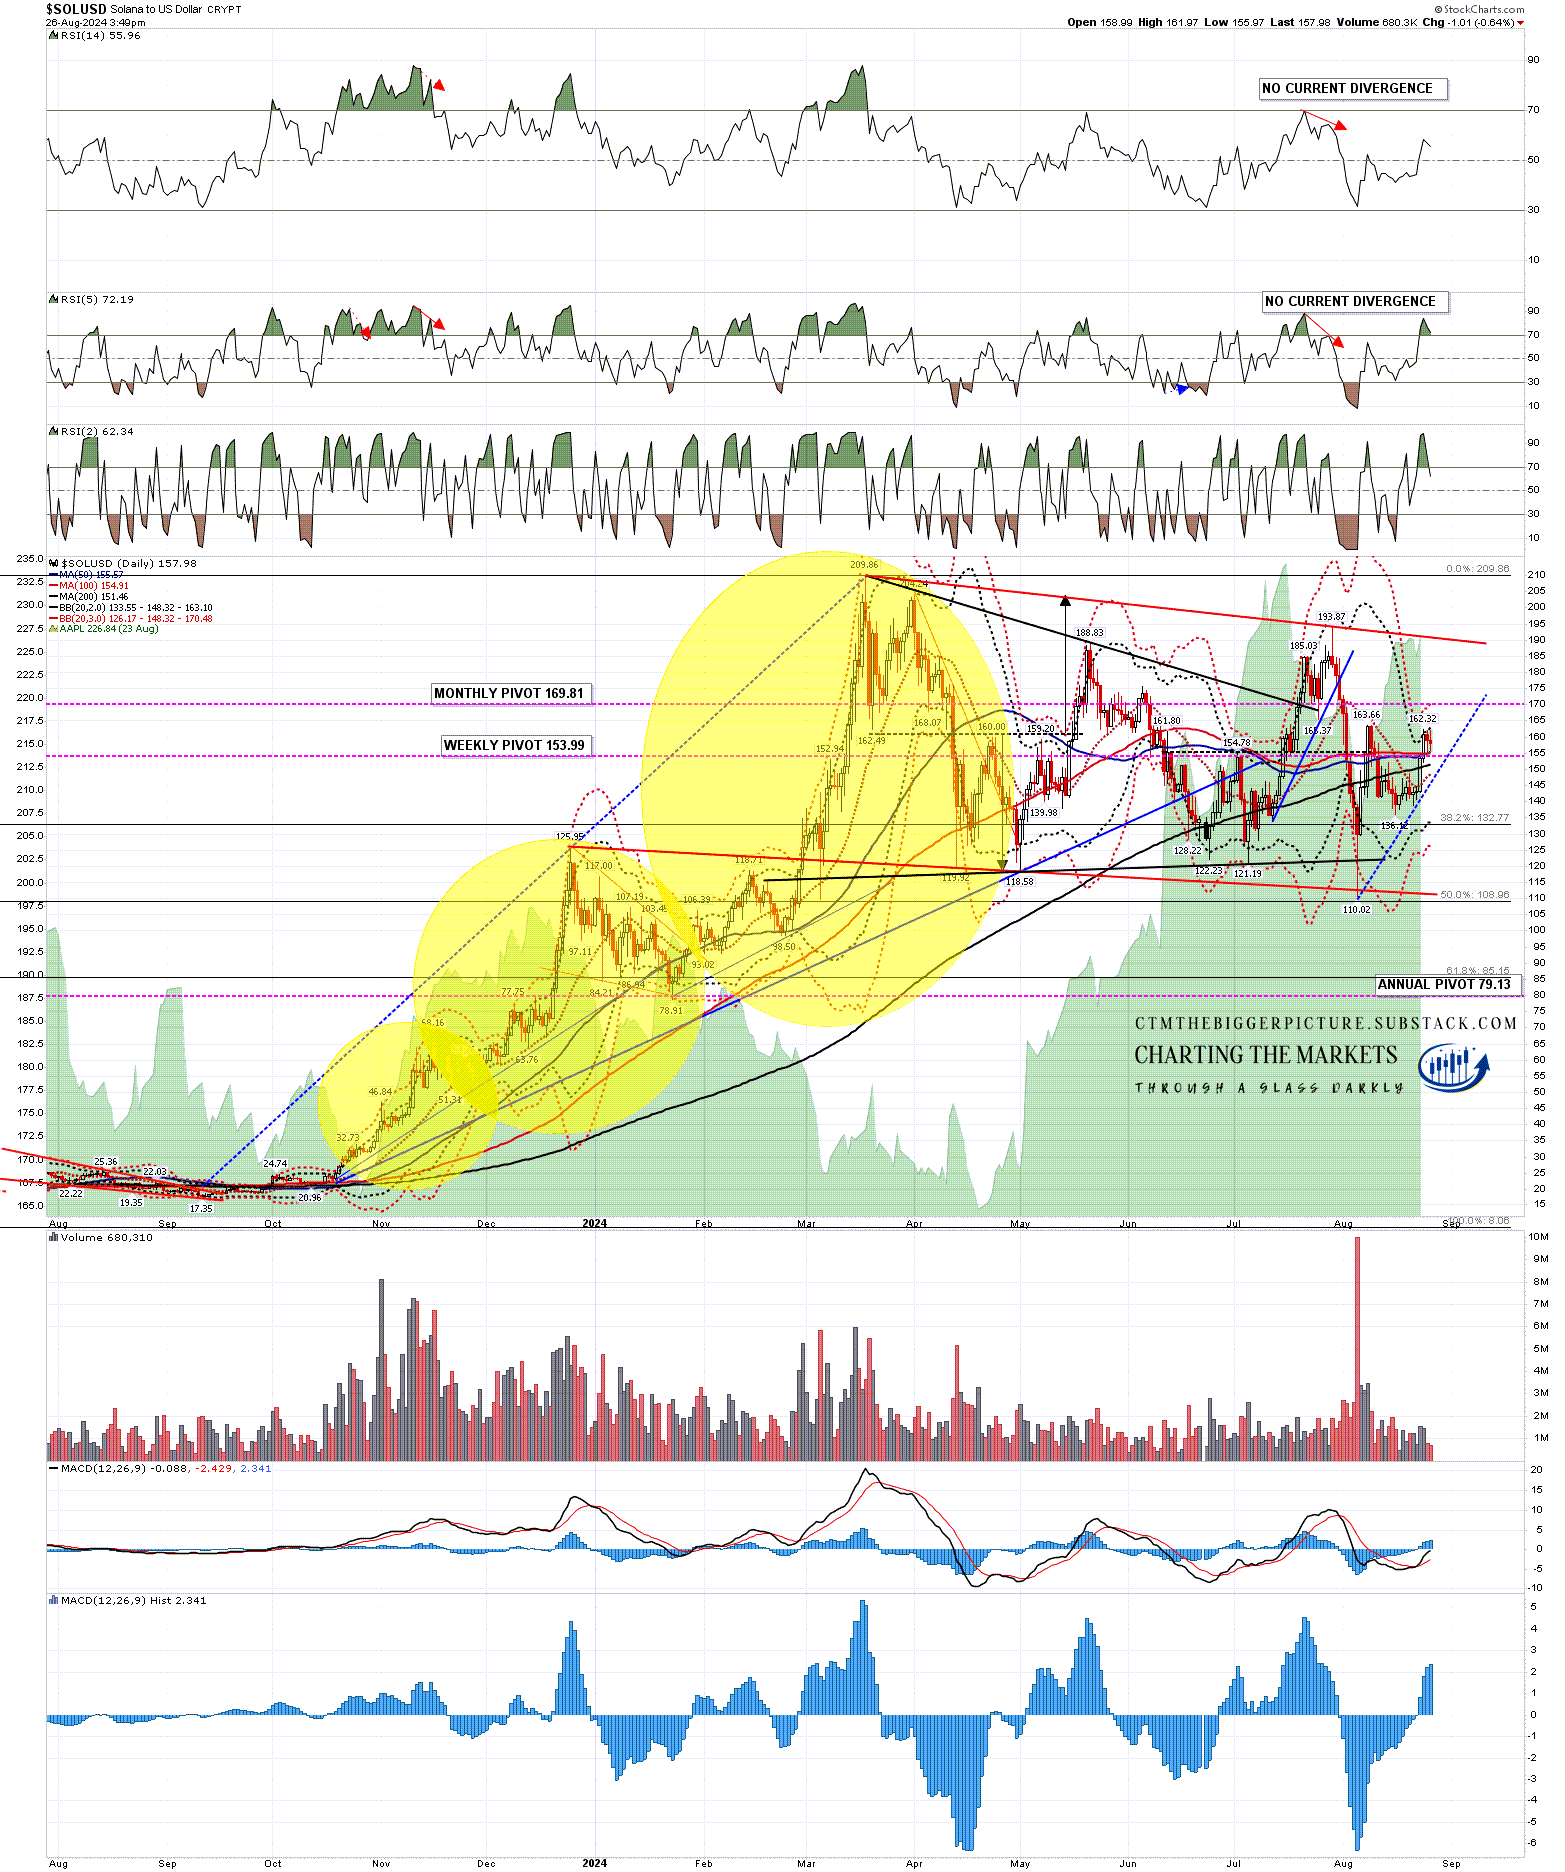
Solana broke strongly over the daily middle band, now at 148.32, the 200dma, now at 151.46, and the 50dma, now at 155.57, and is now at the daily upper band. Some consolidation may be needed here, but after that the obvious next target would be bull flag resistance, currently in the 191 area.
SOLUSD daily chart:
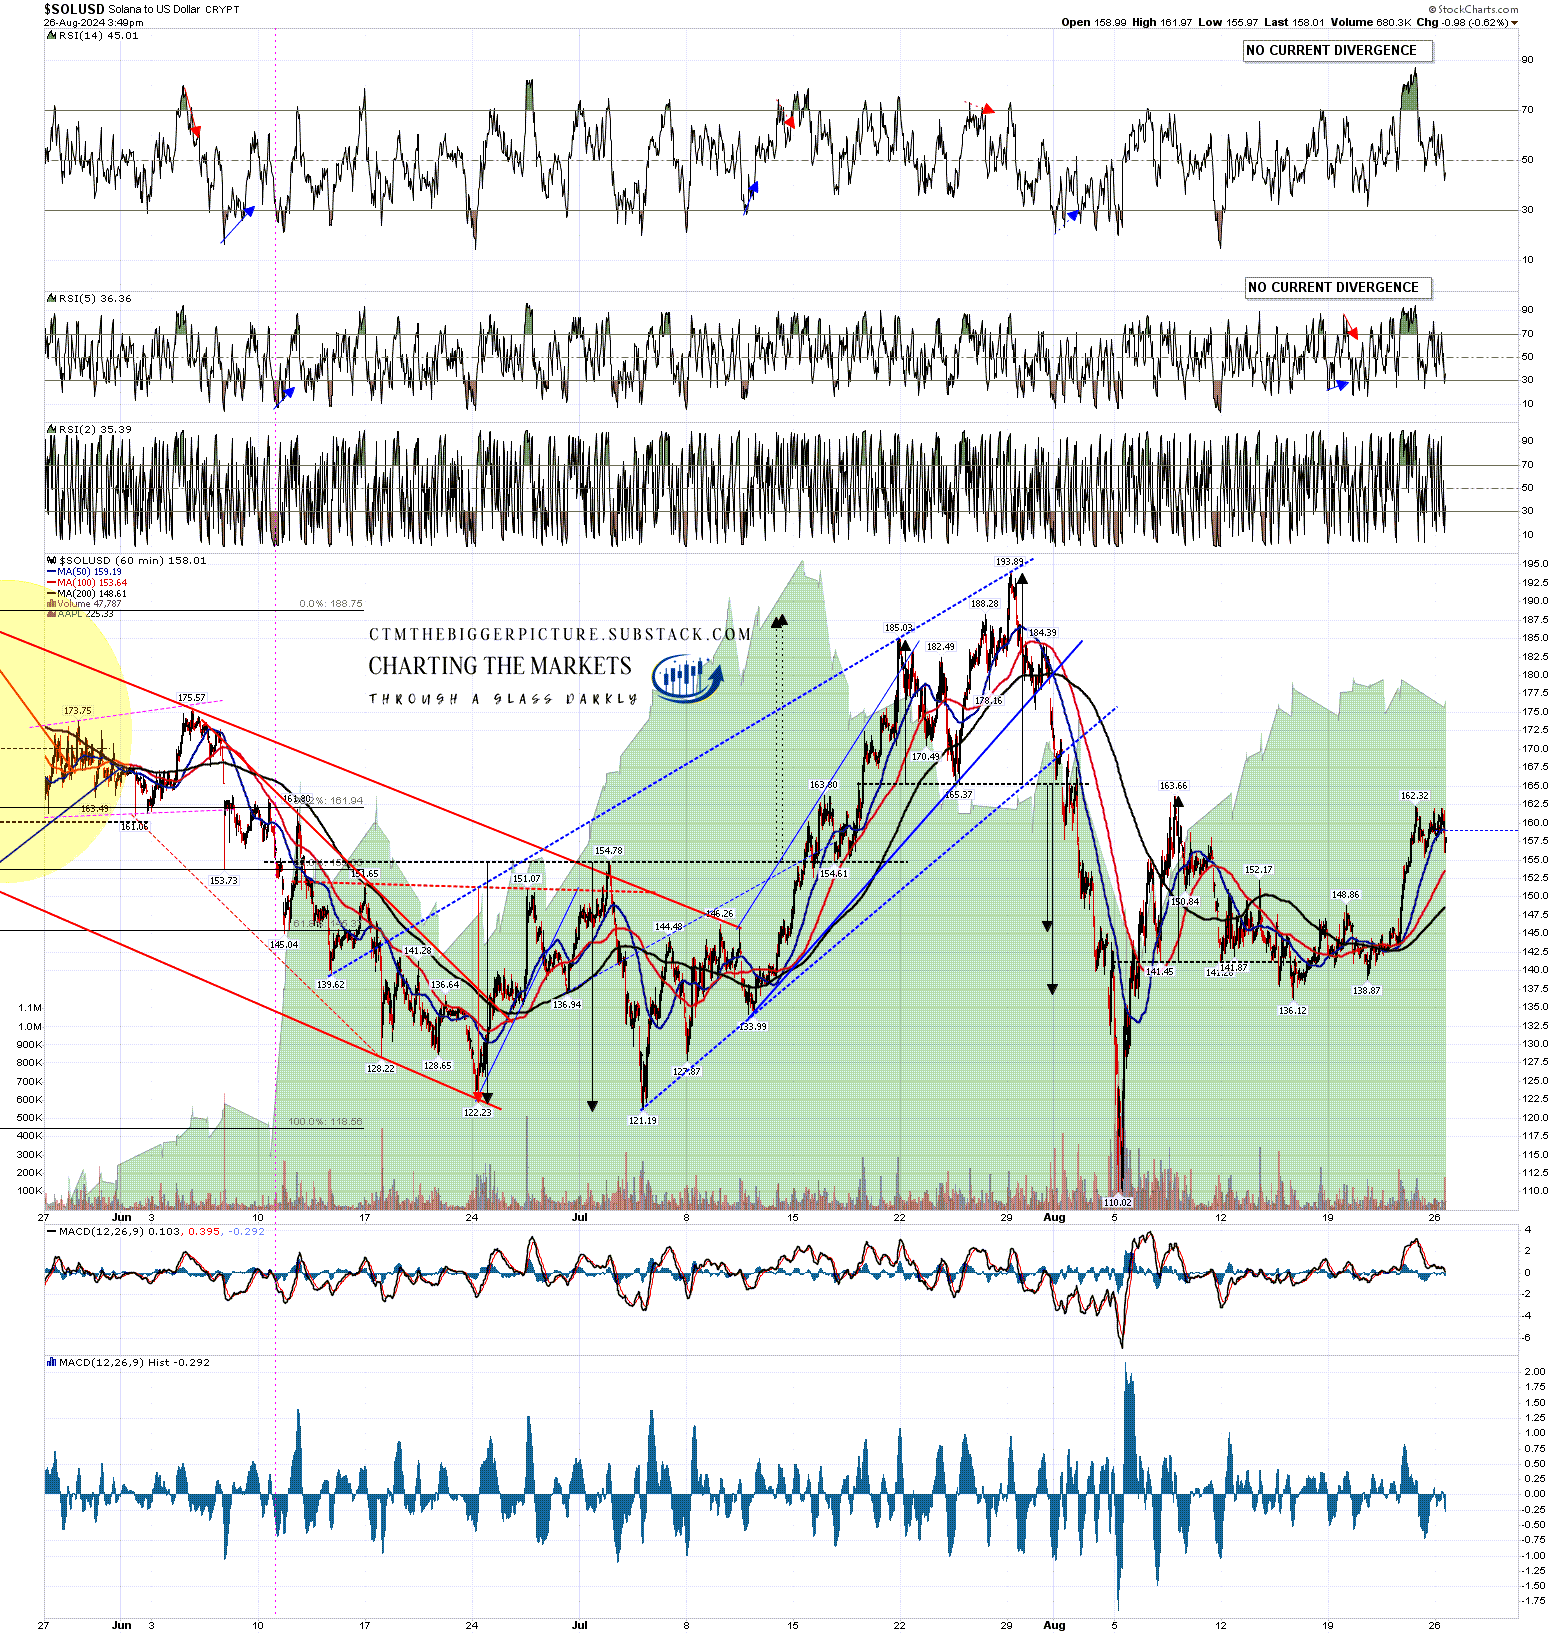
The Solana H&S that broke down a few days ago failed on the move back over the right shoulder high at 152.17, and that failure has a target at a retest of 163.66. That target hasn’t been reached yet and I’m expecting that retest soon.
SOLUSD 60min chart:
There is some bearish potential here short term, but the break last week from the inflection point was bullish, and those daily middle bands are now support. The overall patterns are bullish and as long as the daily middle bands hold as support, the short term outlook will remain bullish into likely retests of the all time high on Bitcoin, and retests of the 2024 highs on Ethereum and Solana at 4092.73 and 209.86 respectively.
If you like my Crypto analysis and would like to see more, please take a free subscription at my Crypto substack, where I publish these posts first and do a short premarket review every morning.
