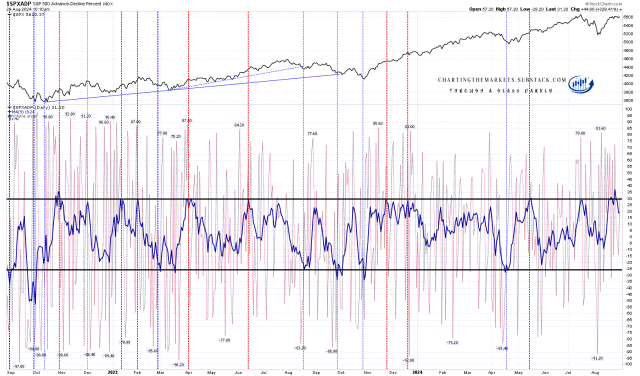
I posted the SPXADP chart a few days ago, and since then it has punched above the 30 level on the chart. What does that mean? Well about 50% of the time that means that a short term high is very close, sometimes for a serious high, but more often just a retracement that would look for close to or at the -25 level on the chart. The rest of the time would be continuation, sometimes into a short term high not long after, but often just a move higher.
A double punch above the 30 level, as we may see that here, would strongly favor retracement or at least a period of consolidation in the weeks afterwards.
SPXADP daily chart:
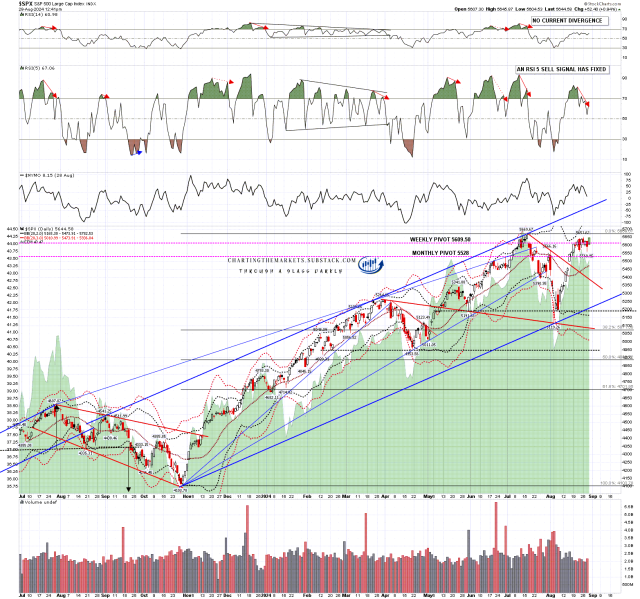
So what is the setup for a decent retracement from this area? Not bad actually. I mentioned when SPX dropped sharply into the 5119.26 low that if SPX was topping out for a significant high, then 70% of the time that would involve a high retest, and SPX is close to that high retest, which will set up a good quality double top pattern.
On yesterday’s decline a daily RSI 5 sell signal fixed on SPX and this has a target on the daily RSI 5 back in the 30-5 area. These are good signals though I would note that during the collapse upwards over the last year only four of the six of these signals that fixed reached target.
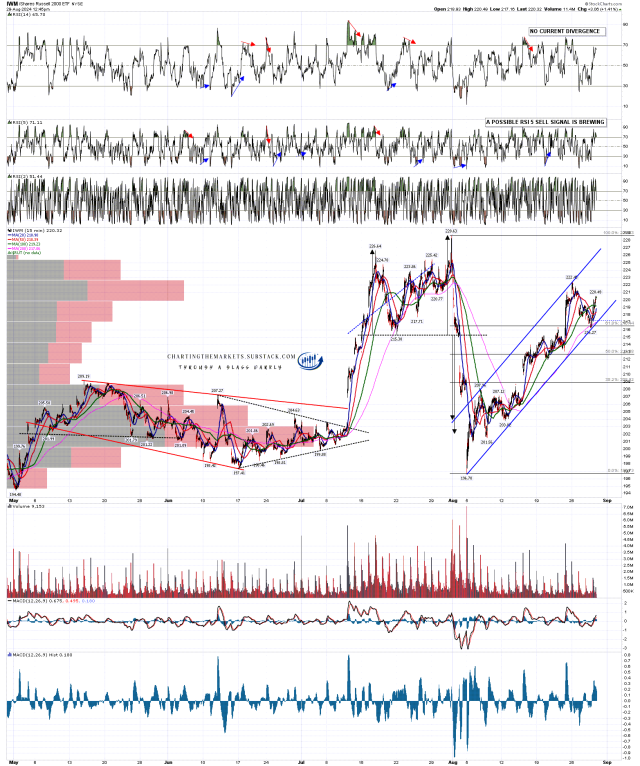
Another possible daily RSI 5 sell signal is brewing on Dow and that hasn’t fixed yet, and if IWM retests the short term high at 222.45, another would start brewing there too.
I had my doubts about seeing much downside action in the month before the presidential election, but looking at these historically since 2000, that looks very possible (more detail on this in the conclusion) and September is also traditionally one of the weakest months of the year.
On the bull side I would mention that there is a high quality rising wedge established from the October 2023 low and the next obvious target within the wedge would be the wedge resistance trendline, currently in the 5890 area. If there is no imminent retracement coming, then that trendline would be the obvious next target.
SPX daily BBs chart:
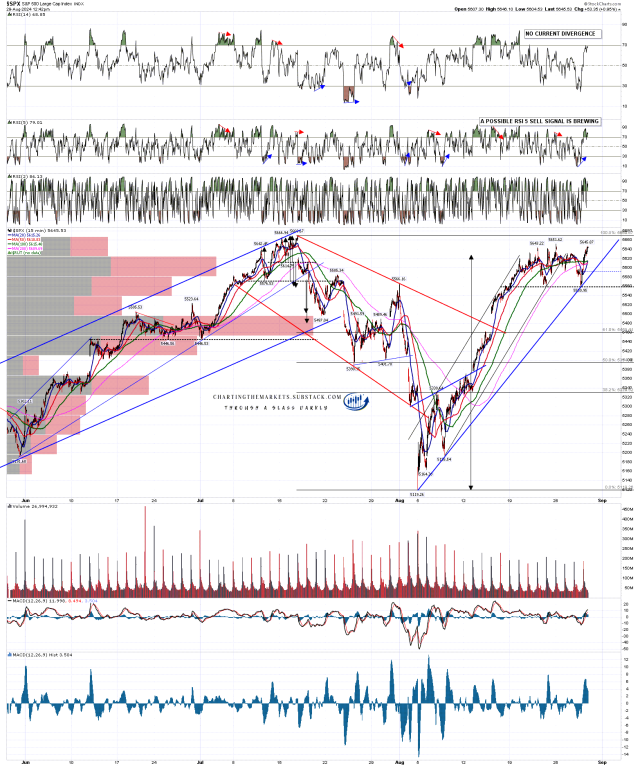
On SPX I’m expecting to see a full retest of the all time high soon, and with Labor Day on Monday and likely bullish holiday tape into and immediately after that, I’m thinking that retest likely happens by Wednesday at the latest. That would set up another possible large double top to join the one already set up on Dow.
SPX 15min chart:
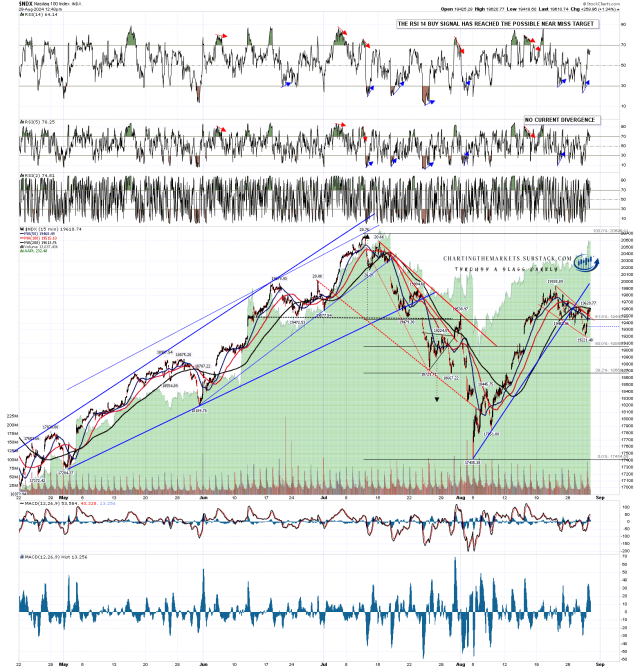
I’m more doubtful about seeing the all time high retested on NDX, as it has been trailing the other indices for the last few weeks, and has failed to catch much of a bid even after a solid beat on NVDA yesterday, but the bull flag that has formed this week and has now broken up is suggesting that a retest of the short term high on 19,938.89 is likely soon. NDX is the only one of the main indices that is not close to a daily RSI divergence, as it has been too weak.
NDX 15min chart:
IWM has formed a high quality rising channel from the early August low, so on a full retest of the last high at 222.45 a possible daily RSI 5 sell signal will start brewing, and the next obvious target within the channel would be channel resistance, currently in the 226.5 area, and close to the retest of the 2024 high at 228.63. As channel resistance is rising rapidly, a retest of 228.63 could easily be done within that rising channel, and that retest would set up a possible third solid large double top setup on IWM.
IWM 15min chart:
Overall this is a decent setup for a significant high forming here, though ideally we would see all time high retests soon on SPX and IWM soon to strengthen that further.
Could we see a very sharp retracement into the presidential election? It wouldn’t be unprecedented at all. The elections in 2000 and 2008 took place in strong bear markets, and there was a long consolidation into the election in 2004, and sharp retracements into all of the the 2012 and 2016 and 2020 elections. That means that in the last 24 years at least, it would be unusual not to see a bearish election September. The best any election September has achieved in that time is a small gain, most of these have closed down. We’ll see.
If you like my analysis and would like to see more, please take a free subscription at my chartingthemarkets substack, where I publish these posts first and do a short premarket review every morning.

