
I’m leaving theartofchart.net today, my main base for almost nine years now, and setting up a new site at chartingthemarkets.substack.com though I seem to have unintentionally picked a really wild day to do that, so this is my second post today to cover the setup here on equity indices as well as my previous post today on crypto.
Why am I leaving theartofchart.net? Well many reasons really, but I’ve told a few people over the years that a collaboration between chartists might be reasonably compared to musicians forming a band. There comes a time when it is just time to move on, and I want to expand on my premarket videos and deepen my work and involvement with cryptos which it will now be easier to do.
On to the markets. I was saying in my premarket video on Thursday 1st Aug that ES & NQ particularly were in an area where they could fail into lower lows, and obviously we saw that. I was saying in my premarket video on Friday 2nd Aug that unless we saw wider participation from non-tech heavy indices then the prospects for further downside would likely be limited, and we saw that participation. In my premarket webinar this morning I was saying that equity indices were hitting their daily 3sd lower bands and that at minimum I’d be looking for a likely strong rally & we’re seeing that at the moment.
So what now?
One thing I was mentioning in my Chart Chat video yesterday was that the equity indices are breaking down from their rising trend patterns from the October 2023 low, and that we might well be looking at larger moves here towards the retracement waves for those patterns.
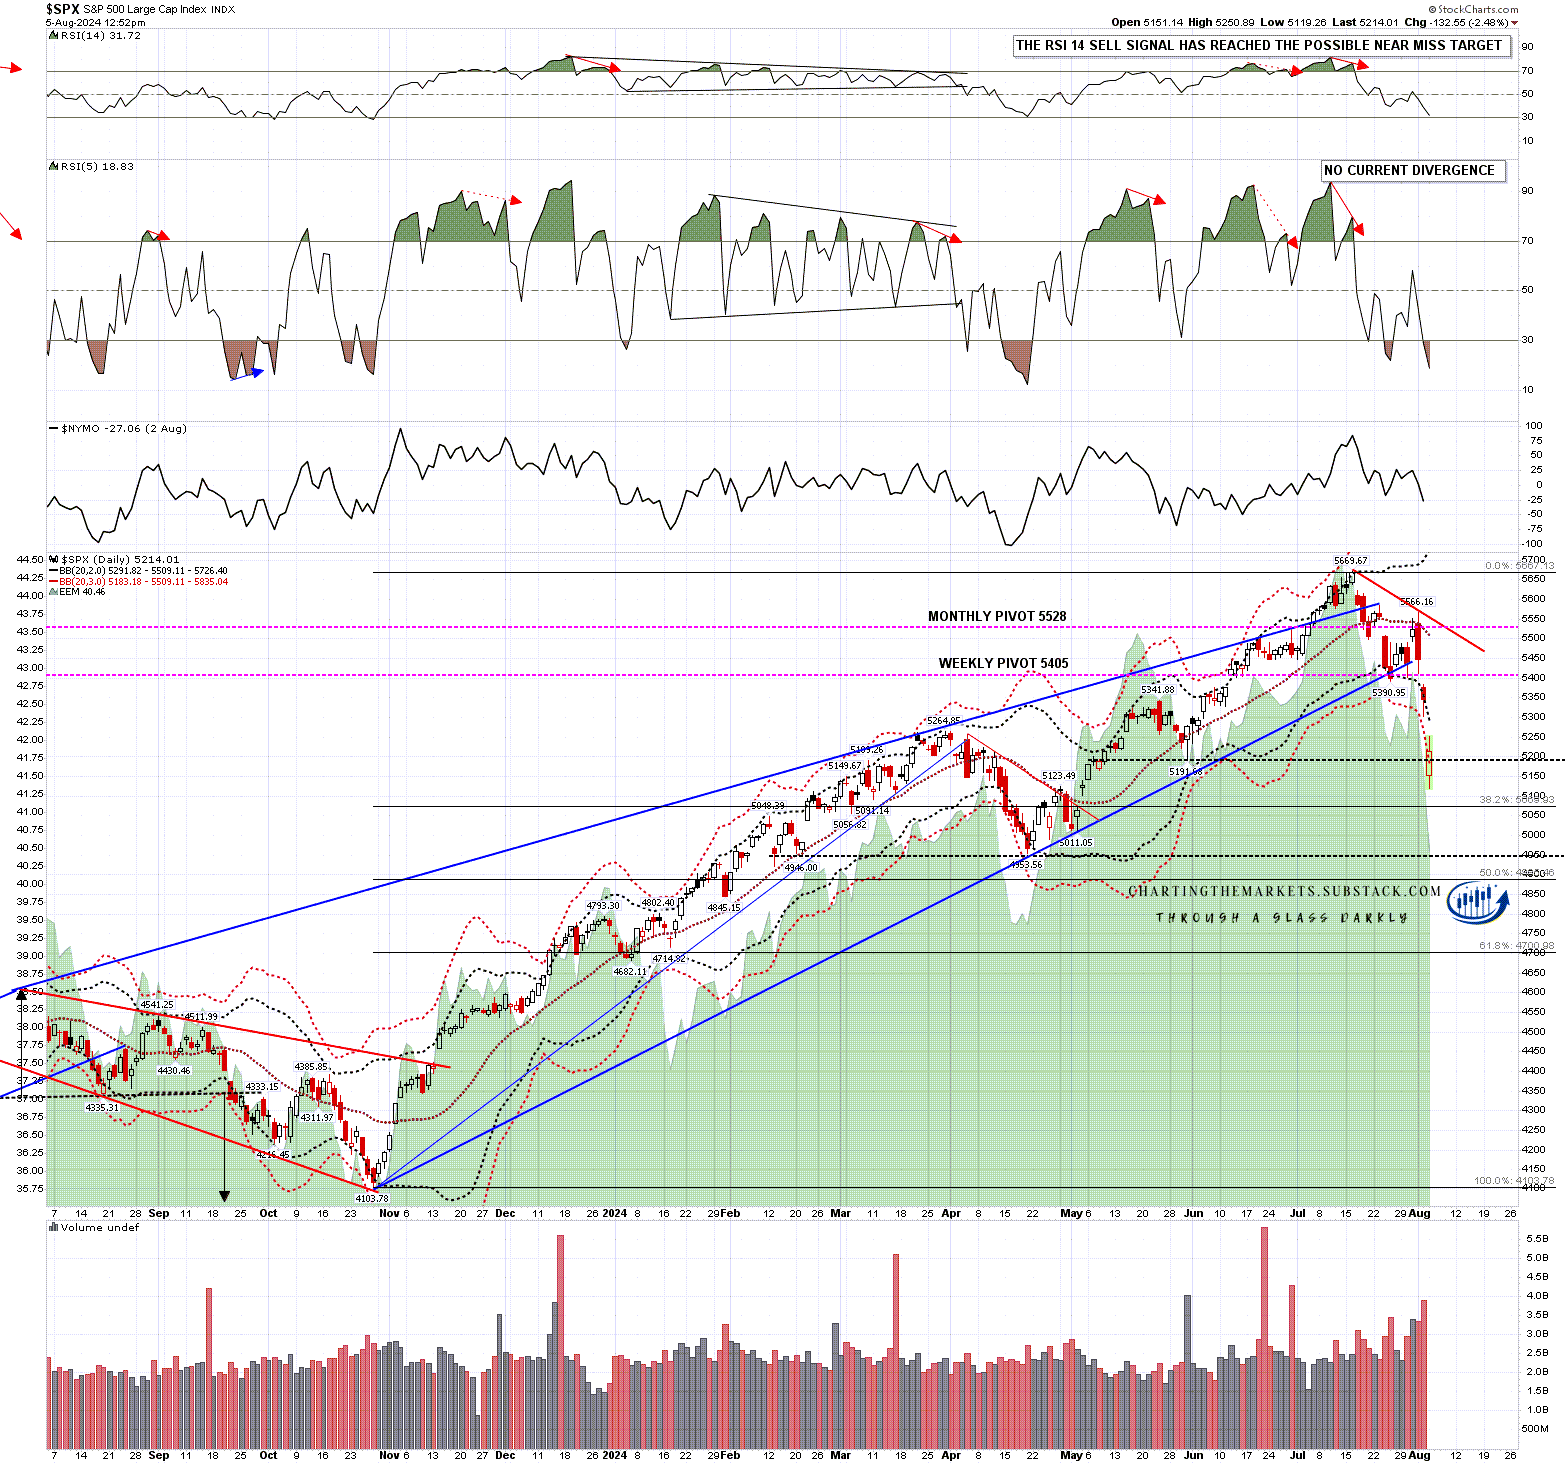
On SPX the rising wedge from October 2023 low has broken down and SPX has spent much of the day at or below the 3sd lower band. That will generally deliver a strong rally but it doesn’t mean that the retracement low is in. I’m watching the 38.2% fib in the 5070 area, and the possible H&S neckline in the 4950 area, not far above the 50% retracement target in the 4900 area. No obvious reason to think that 50% retracement area won’t hold at the moment, but that 4900-50 area may well need a test.
SPX daily BBs chart:
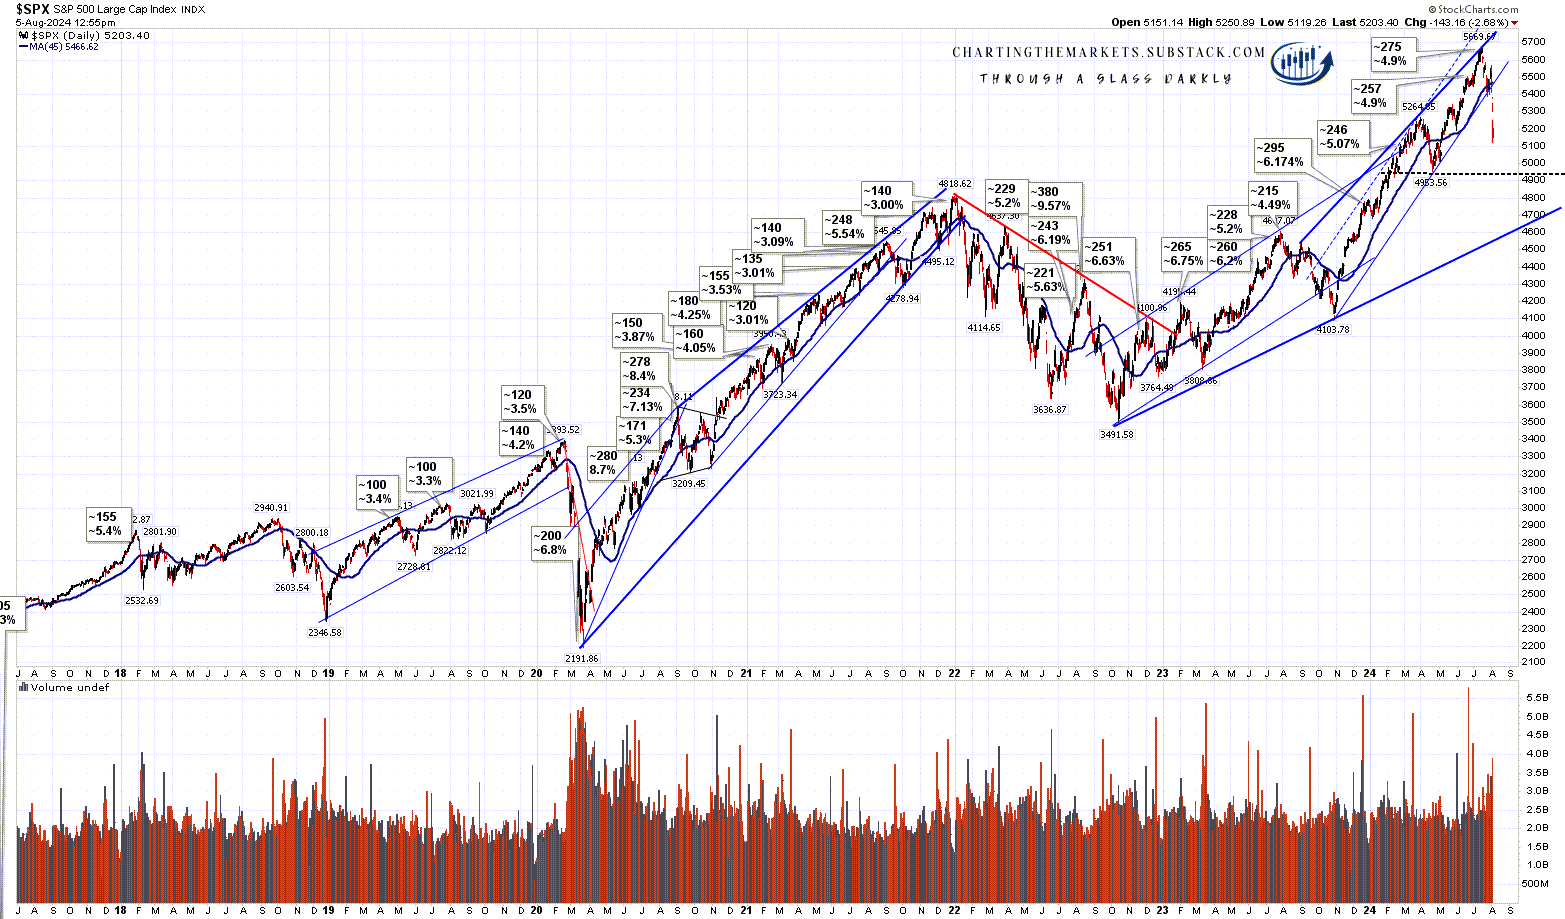
I will just mention that the current distance below the 45dma, currently in the 5466 area, is looking stretched, though this matters less in downtrends than uptrends generally.
SPX daily 45dma chart:
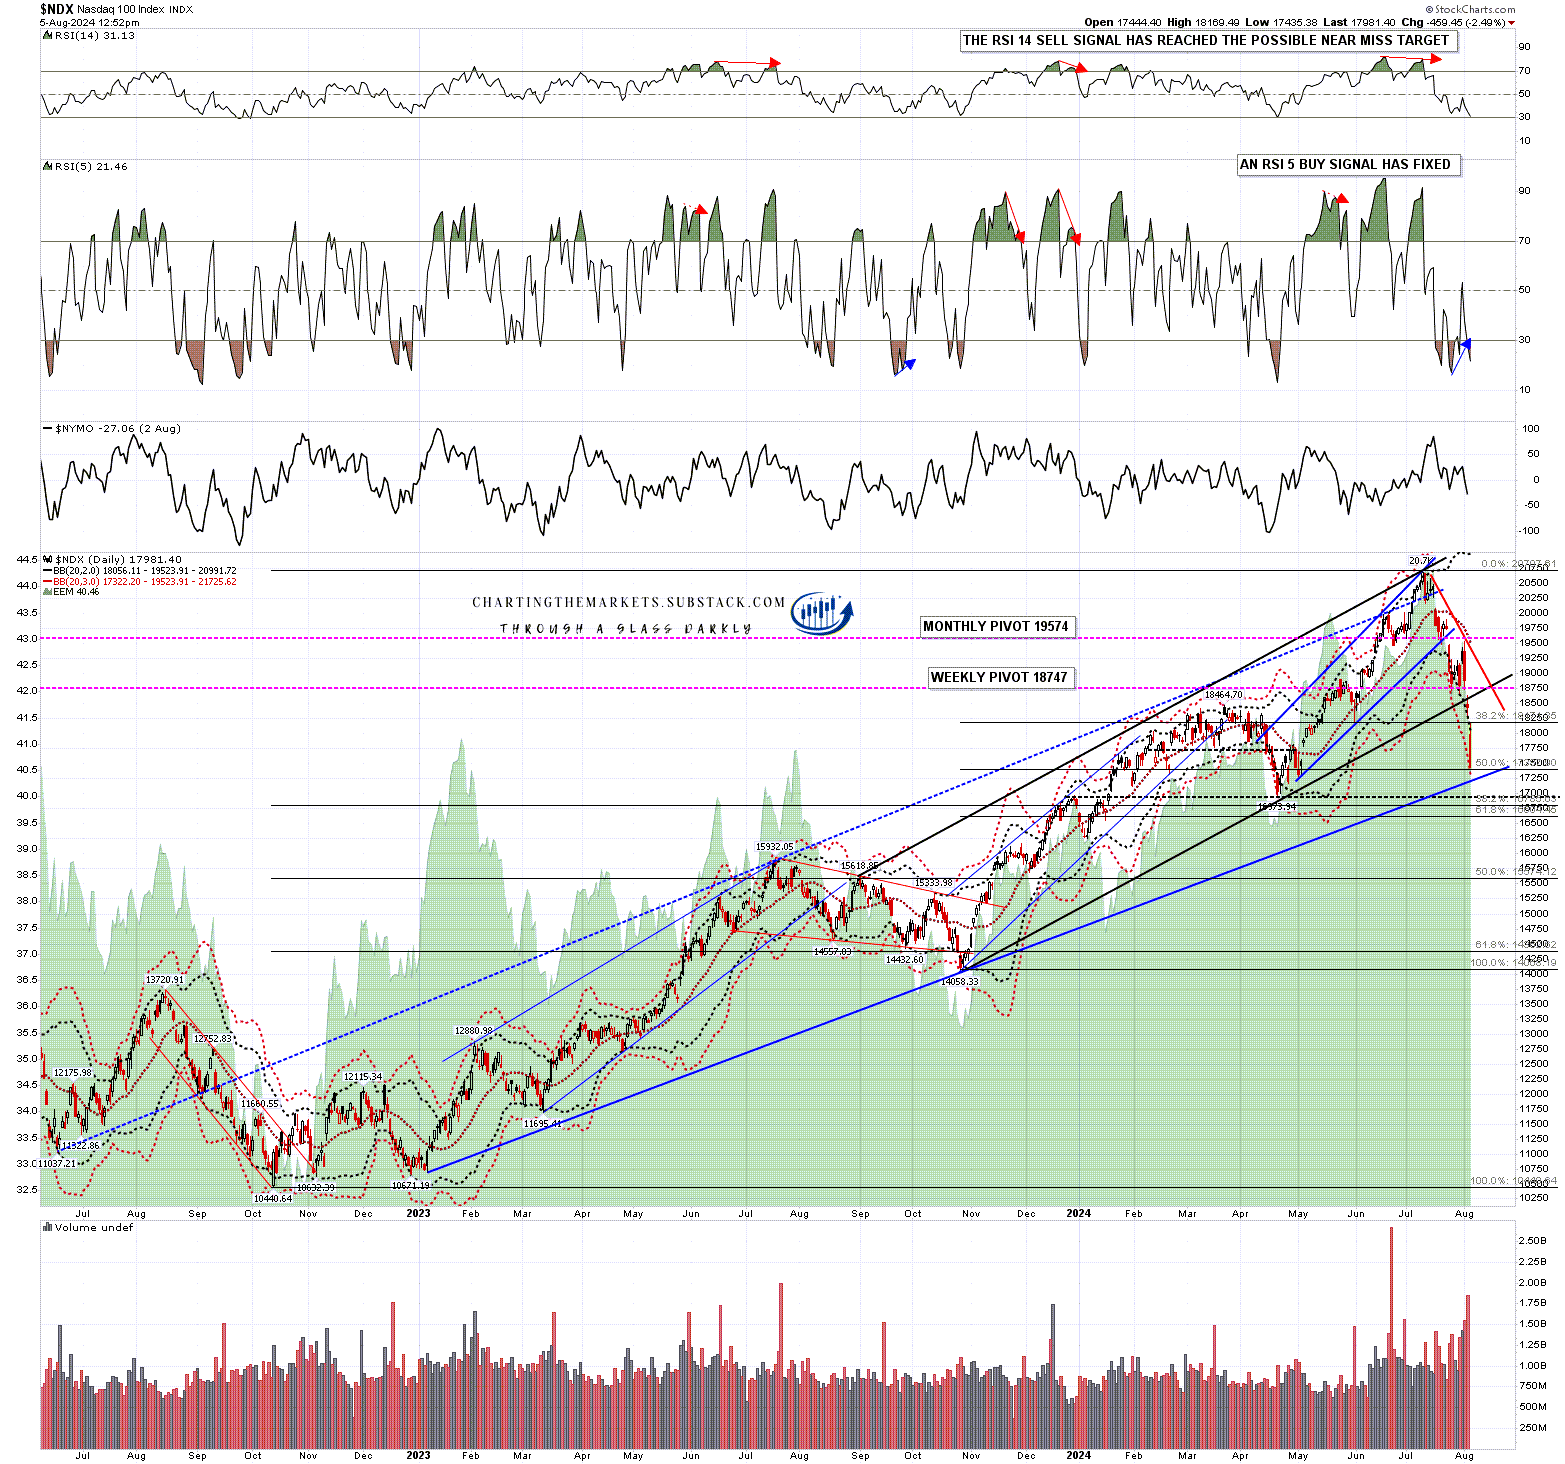
NDX has been leading on the way down and has broken the rising channel from the October 2023 low, and reached the 50% retracement of the move up from the Oct 2023 low this morning. Possible rising support from the Oct 2022 low is just below in the 17200 area and, on a break below, I’d be watching the possible H&S neckline in the 16950 area. As with SPX, NDX tested the daily 3sd lower band at the low today.
NDX daily BBs chart:
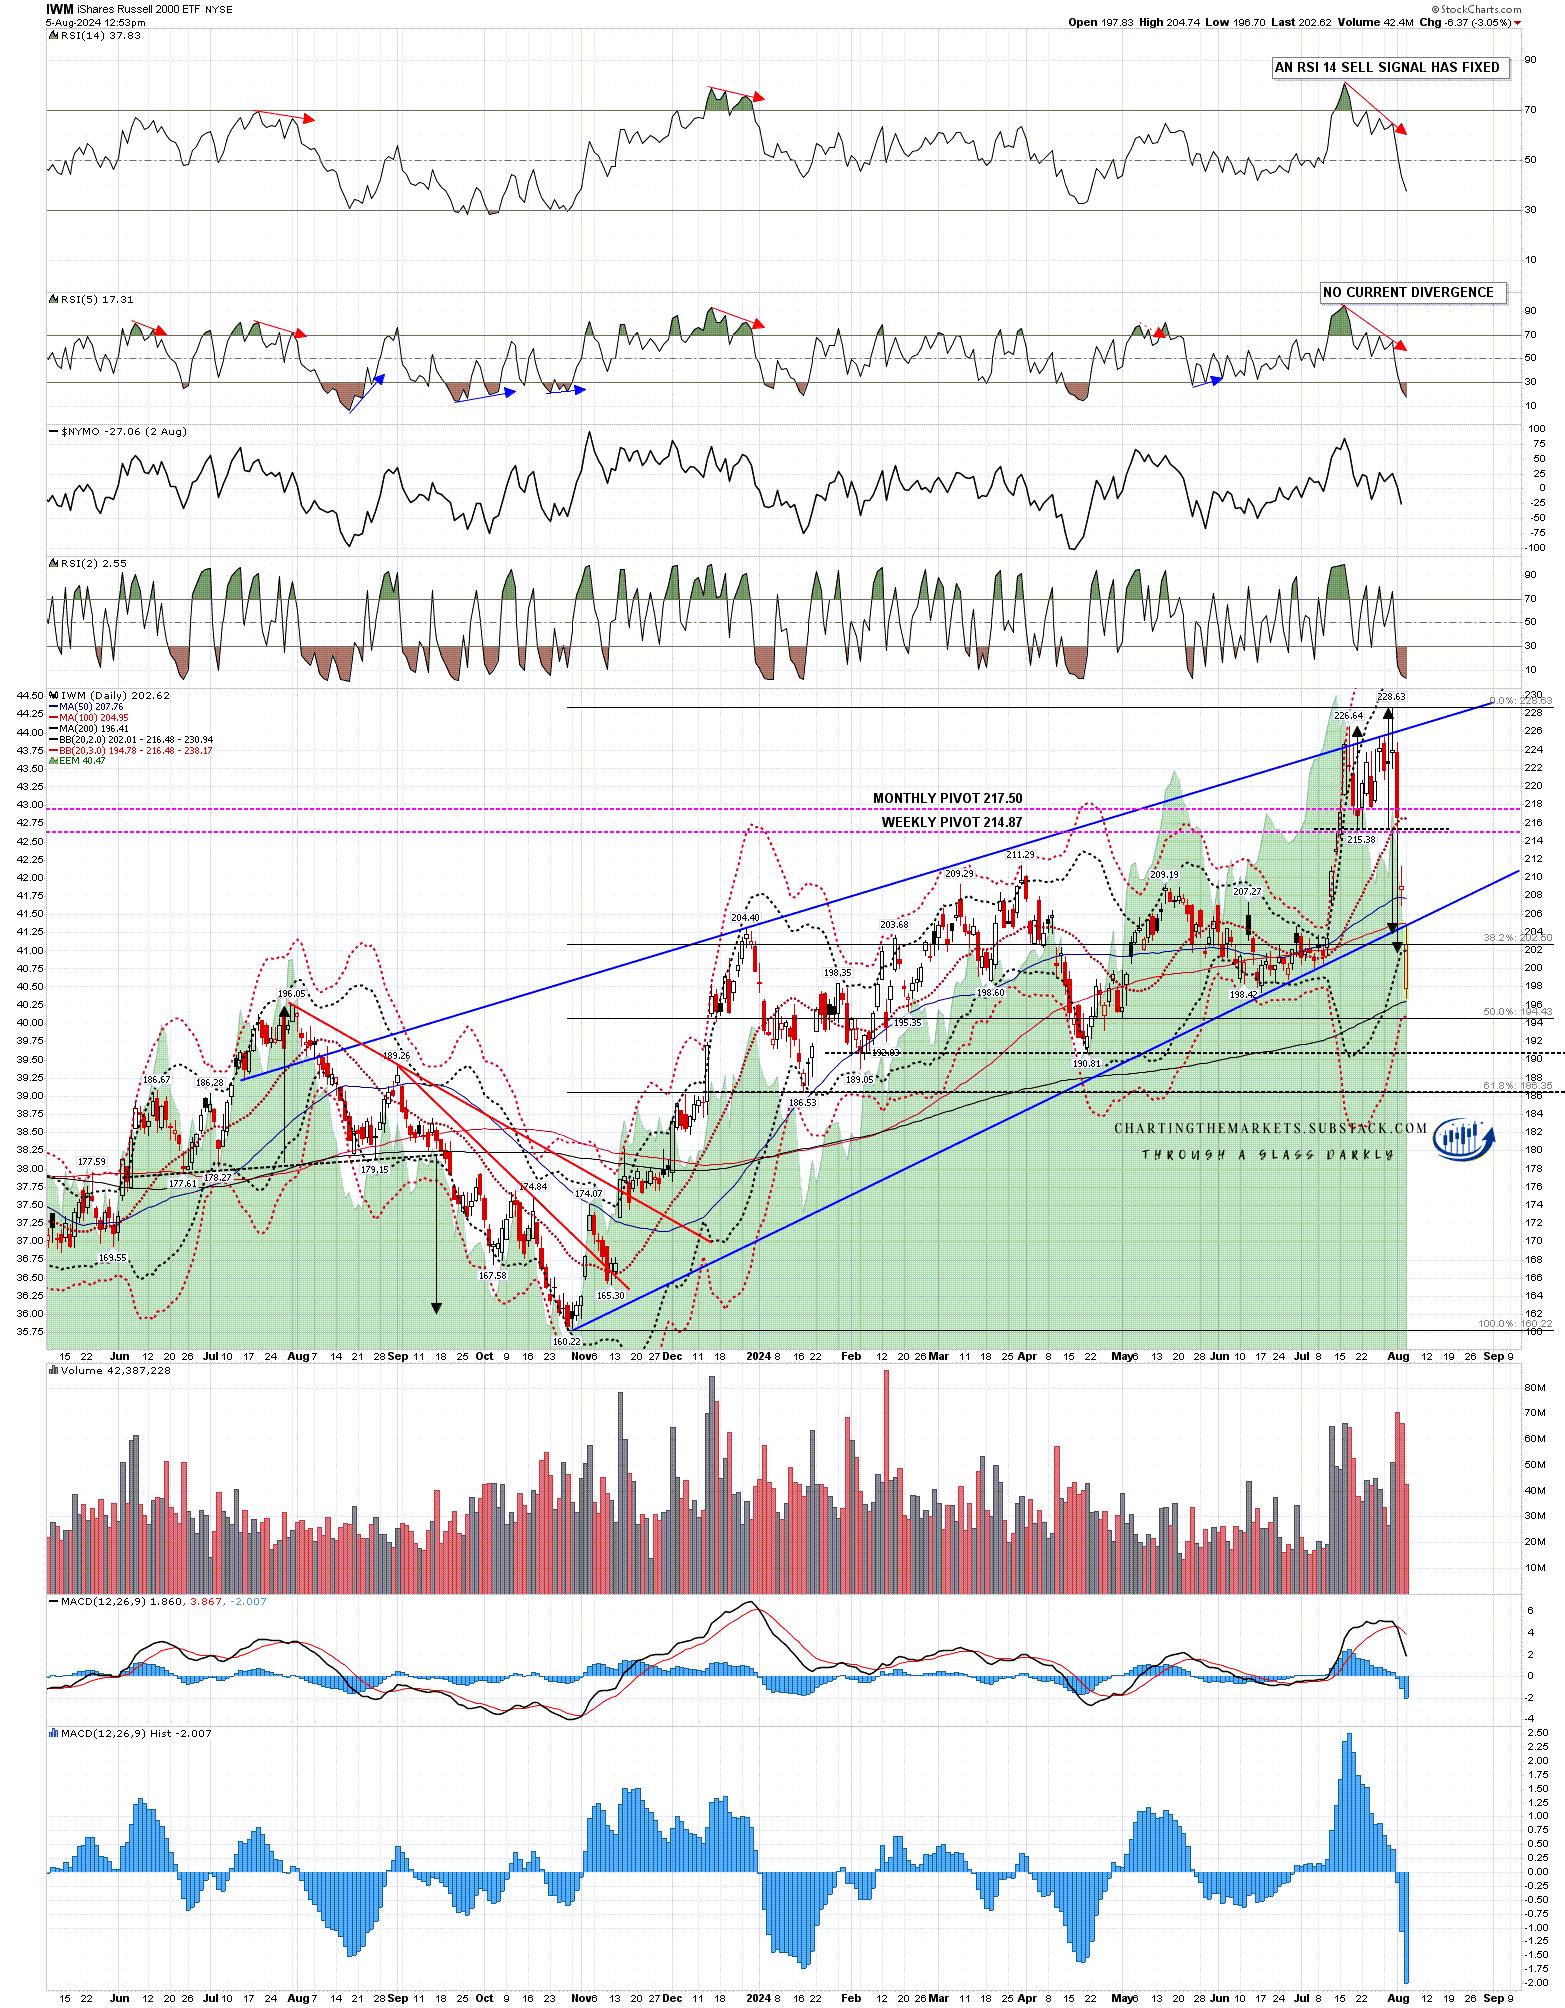
On IWM the little double top I was looking at in my videos last week broke down hard on Friday and made target this morning. I have the daily 3sd lower band and the 50% retracement of the move up from the Oct 2023 low both in the 194.5 area, and am watching the possible H&S neckline in the 191 area.
IWM daily BBs chart:
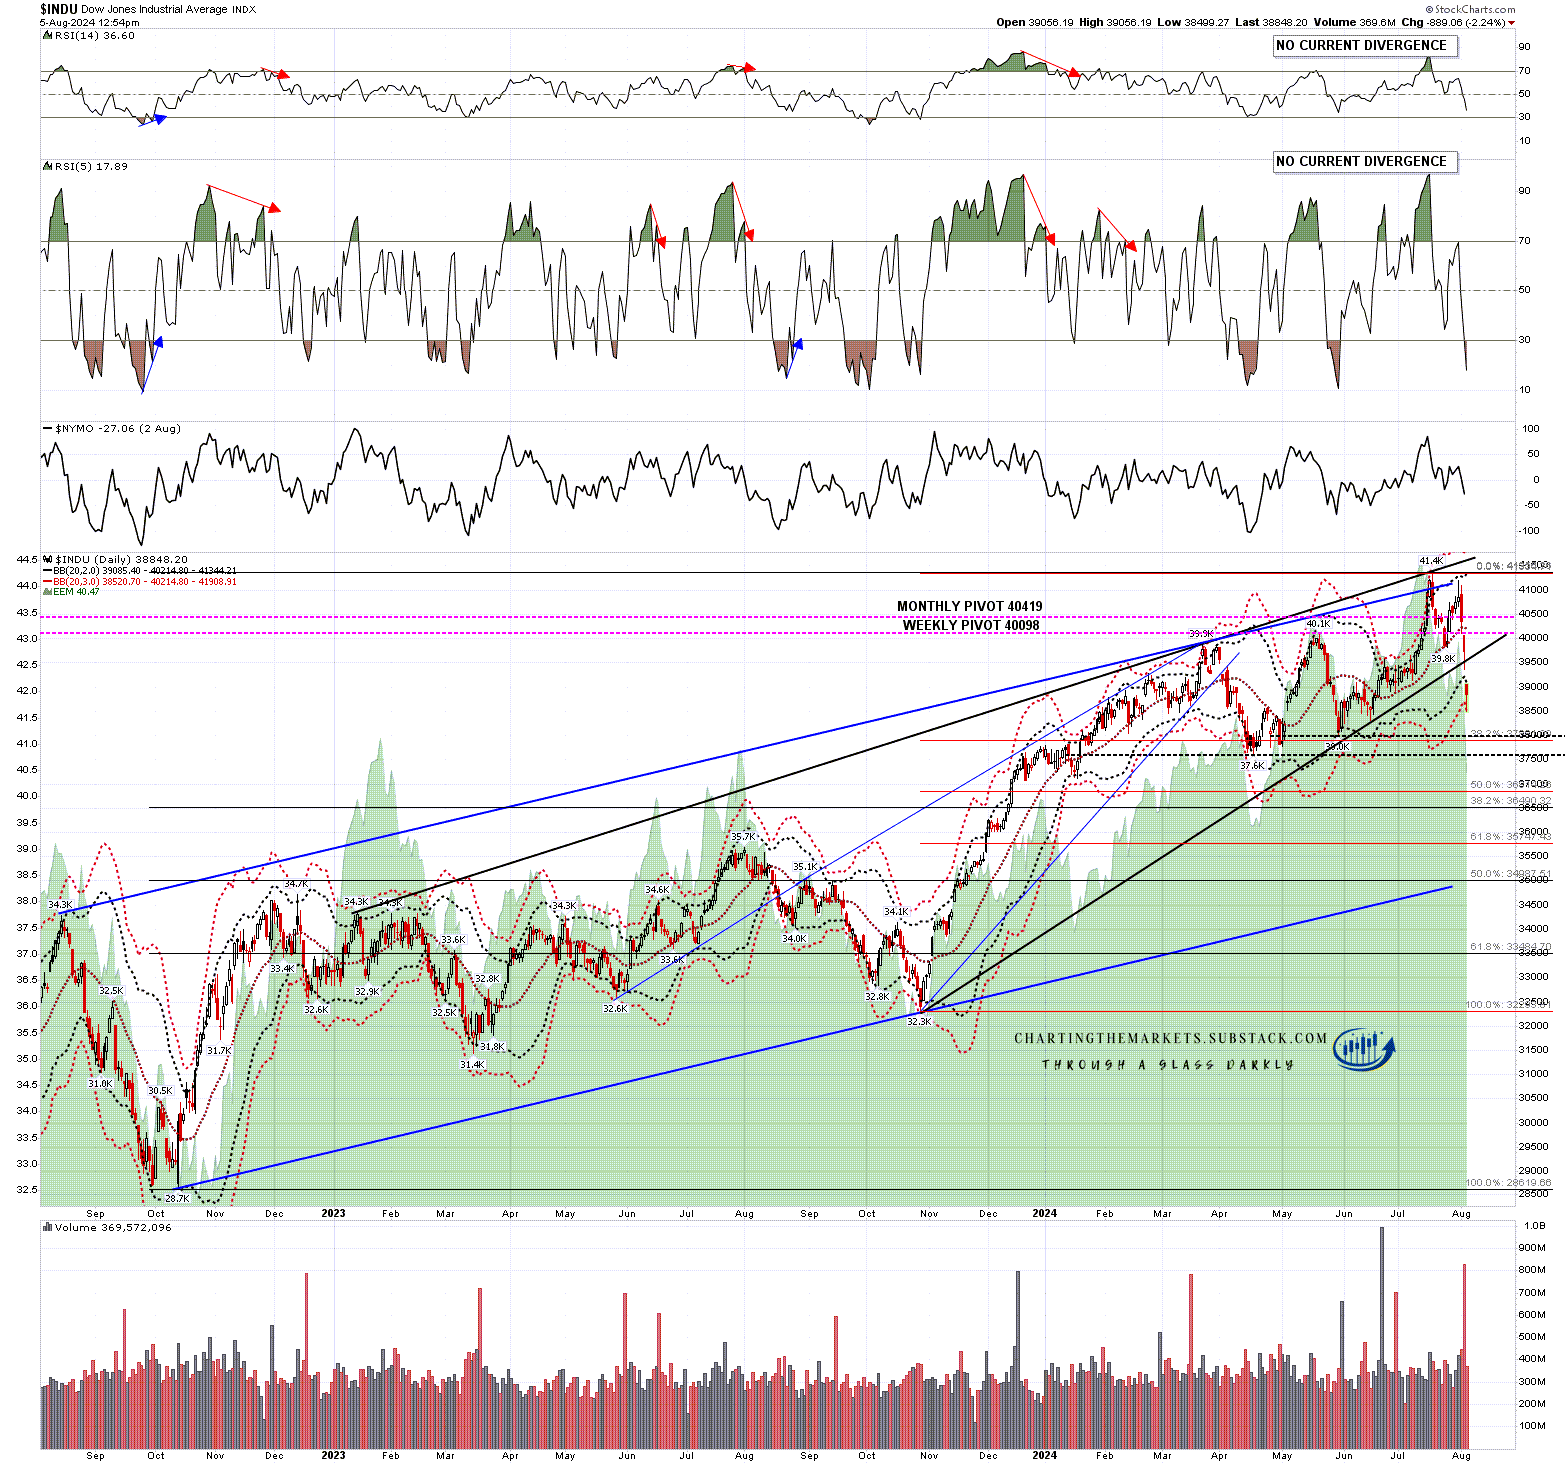
Last but not least is Dow, which broke down on Friday from the rising wedge from the Oct 2023 low, and has thoroughly tested the 3sd lower band today. As with the others, this doesn’t mean the retracement is over, and in truth the indices may continue down tomorrow, but that test was looking for at least a sharp rally in response. On the downside I’m watching the 38.2% fib retracement level in the 38,000 area, the possible H&S neckline in the 37,500 area, and the 50% retracement level just under 37,000.
INDU daily BBs chart:
So why the badgers in the title? Well I had a trading bud a few years back who used to describe tape on days like Friday and today as ‘angry badgers’ tape. I always liked the image and the badgers were certainly looking pretty angry this morning, though they have calmed down a bit since.
Many of my international index charts are EOD only, so I don’t have today’s data on those yet. They are pretty interesting though, so I’m planning a post tomorrow looking at those and weighing the implications of the moves there.
You can now find my work at chartingthemarkets.substack.com and on my twitter (shjcharts). I’ll be setting up my substack for the rest of the week and while I’m doing that my premarket webinars are free to all, with the links posted shortly before on my twitter). I’m planning to get into a routine of doing a premarket webinar on cryptos at 9am EST, and a premarket webinar on equity indices and futures at 9.10am EST. Until tomorrow :-).
