
What We Bought During Monday’s Market Meltdown
In recent posts, I’ve posted the basic game plan I’ve shared with my subscribers:
- If you’re concerned about downside risk for positions you already own, consider hedging. As a reminder, you can download our iPhone hedging app here, or by aiming your iPhone camera at the QR code below.

- We’ll use up days to add short positions, and down days to add long positions, when we surface compelling ideas.
Here’s an example of how we implemented that second point in the Portfolio Armor trading Substack on Monday.
Surfacing Compelling Ideas
One of the screens I mentioned last week that I’d be using was this one:
- PEG (Next Year) < 1
- PEG (5-Year) <1
- RSI < 30
Let’s break that down. PEG is the Price/Earnings ratio divided by the stock’s growth rate. It’s a way to compare apples to apples when evaluating stocks with different growth rates: with a high enough growth rate, a stock with a 30 P/E can be cheaper than a stock with a 15 P/E. The 5 year PEG compares the stock’s current P/E to its growth rate over the last 5 years, and the Next Year PEG compares its P/E to its estimated growth rate next year.
RSI is the Relative Strength Index, a measure of whether a stock is overbought or oversold (typically, values over 70 are considered overbought, and values under 30 are considered oversold).
One Of The Names That Came Up On That Screen
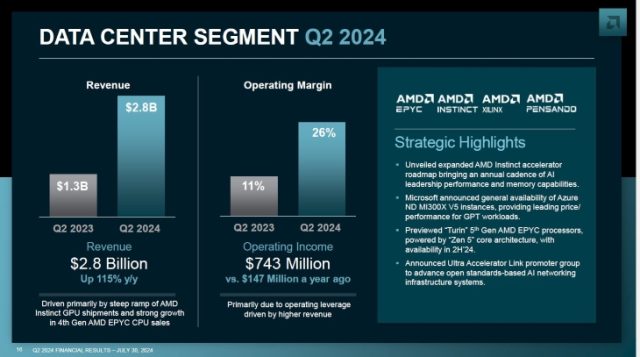
One of the names that came up on that screen was Super Micro Computer (SMCI), a previous Portfolio Armor top ten name, which is one of the hardware companies benefiting from the AI boom. I know some are calling it an AI bubble now, but last week’s earnings report for the chip company Advanced Micro Devices (AMD) suggest otherwise.
Here’s how Super Micro Computer looks on our screen above, according to Chartmill data:
- PEG (Next Year): 0.3
- PEG (5-Year): 0.57
- RSI: 27.61
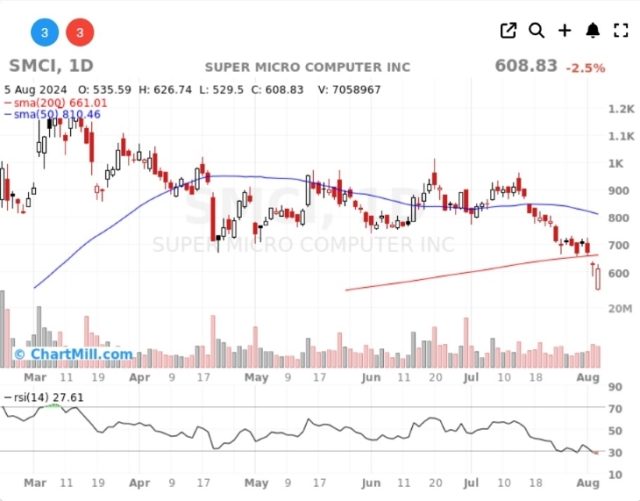
On Monday morning, when SMCI was trading in the mid-500s, its RSI was even lower–about 24, if I recall correctly.
Monday’s SMCI Trade

With SMCI trading at about $550 early Monday, we opened a vertical spread on it expiring on August 9th, buying the $590 strike calls and selling the $595 strike calls for a net debit of $1.65.
The maximum gain on this kind of spread is the distance between the strike prices, so, in this case, $5. And that maximum gain occurs when the stock is trading above $595. So if SMCI is trading over $595 at Friday’s close, this trade will result in a ~200% profit.
SMCI closed at $608.83 on Monday, and is trading at about $621 after hours, as I type this. It reports earnings after the close on Tuesday. Estimize predicts an earnings beat; if they’re right, we should be in good shape on this trade. But the worst case scenario here is a 100% loss, so this is a heads I win 2x, tails I lose 1x situation.
If you’d like a heads up when we place our next trade, feel free to subscribe to our trading Substack/occasional email list below.
If you’d like to stay in touch
You can scan for optimal hedges for individual securities, find our current top ten names, and create hedged portfolios on our website. You can also follow Portfolio Armor on X here, or become a free subscriber to our trading Substack using the link below (we’re using that for our occasional emails now).