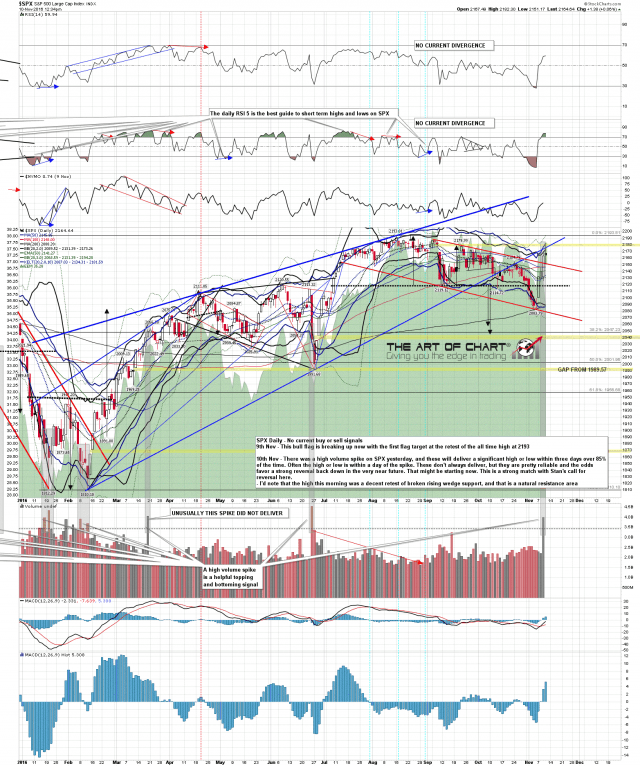
SPX has gone a bit higher than Stan was expecting this morning, but there was a big volume spike yesterday that strongly supports his expectation that a significant high is being made here, and that we may well retrace much or all of this powerful post election rally. These don’t always deliver, and I haven’t had a chance to run through performance over the last twenty years yet, but I’ve put these down as 85% odds of a significant high within three days and I think that’s conservative. The only fail I can recall offhand in the last few years was in March this year. SPX daily chart:
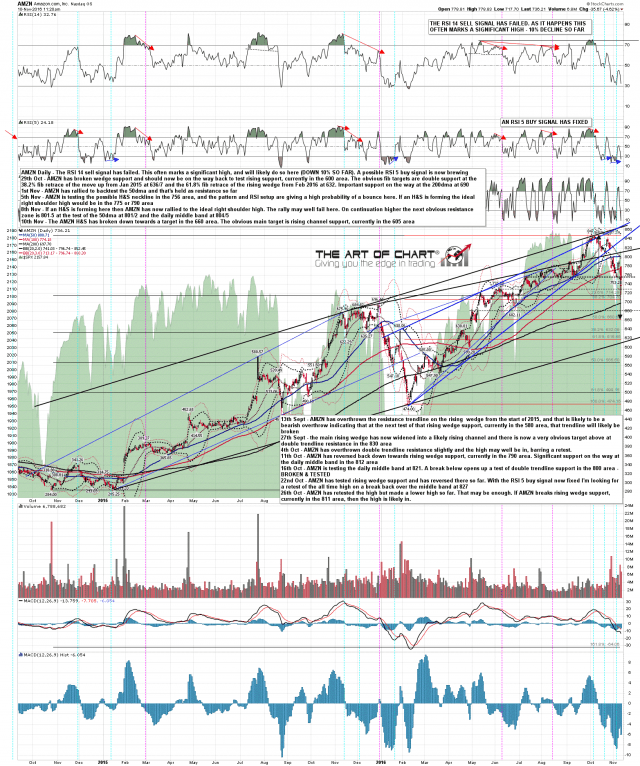
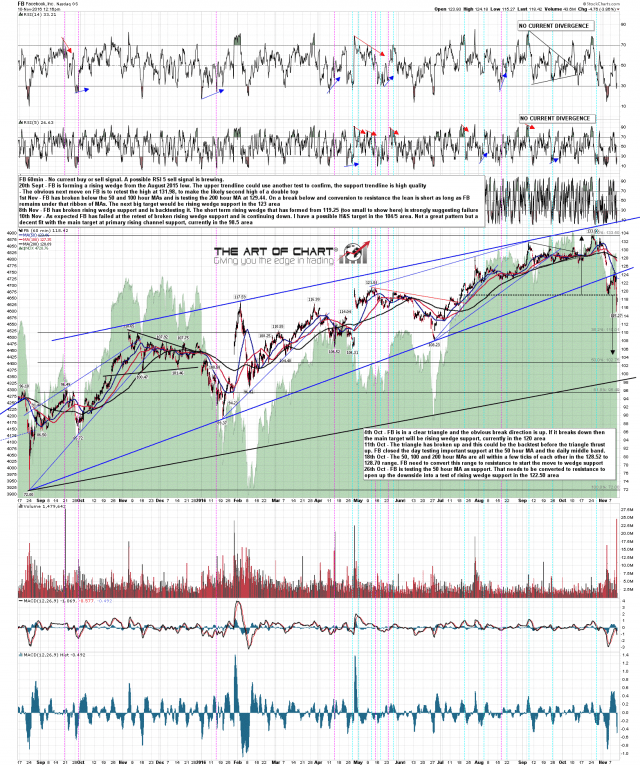
What could fuel this selloff? Well we’d often see a full retracement after a big move caused by a news event. That’s a ‘return to the scene of the crime’ retracement, and these happen all the time over a wide range of trading instruments. My eye is also drawn to a couple of the stocks that we’ve been covering in our Big Five Service at theartofchart.net, and of the five stocks we cover there, AAPL, AMZN, FB, TSLA and NFLX, I’m showing AMZN and FB below, both looking very bearish here, though of the others AAPL and TSLA aren’t looking much better than these two.
Could these wounded mammoths fuel a big decline? Well they might add to one, but these are longer term setups and if we see this retracement on SPX we’d be expecting it to be all over with a few days, and likely rallying from there. I also remember chatting to a trader friend about the implications of a very bearish post I wrote on AAPL on 2nd October 2012 (you can see that here), when we were discussing the impact on the equity indices of the 40% to 50% falling in AAPL that I was expecting then. We both thought that would be a significant drag on index prices, and while AAPL then duly fell 44% or so into June/July 2013, SPX started a bull run in late 2012 that took it up slightly under 40% into the end of 2014. That didn’t leave me with the impression that these kinds of correlations are reliable.
AMZN has just broken down from an H&S and our main target for this move involves a further decline of about 20%. This is a setup that has been developing for a while & it should make that target. It may not stop there, but if it’s going to turn back up, that’s the likely place. AMZN daily chart:
On FB the likely decline is a bit over 15% from here. Again it might not hold the target trendline. We’ll see. FB 60min chart:
Of the others AAPL has an obvious target about 20% lower than it is at the moment and TSLA is starting a triangle thrust down from a big triangle that has formed over the last year. We don’t have a strong target area on TSLA, but the triangle thrust down is only just starting, and I’d expect it to run a while.
These are big moves starting down on some big names and they might well help deliver this short term retracement. Longer term they do seem likely to at least mute any bull moves on the Nasdaq over the next few weeks. These aside though, the volume spike on SPX yesterday is a strong signal to look for a significant move down on equity indices in the near future.
We’ve been nailing the Big Five very well since we launched the service a few weeks ago. If you’re interested we offer a 14 day free trial that you can find here.


