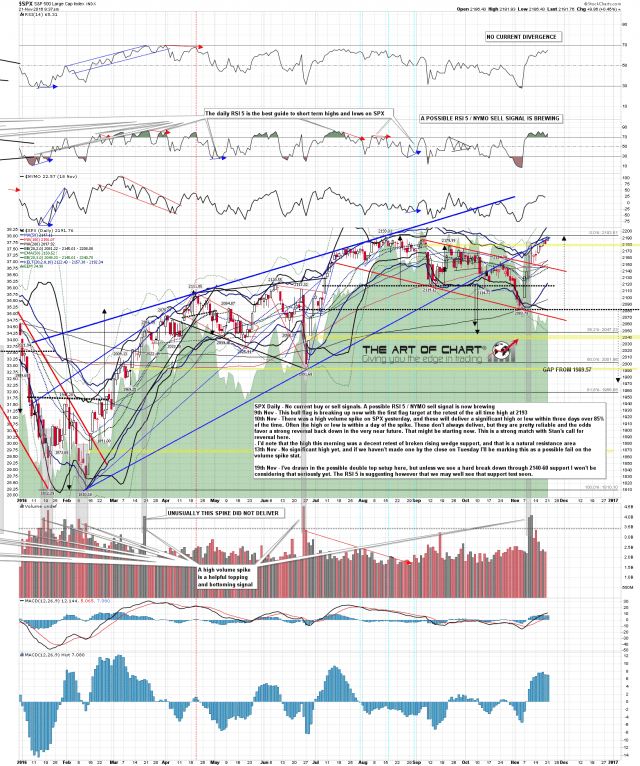
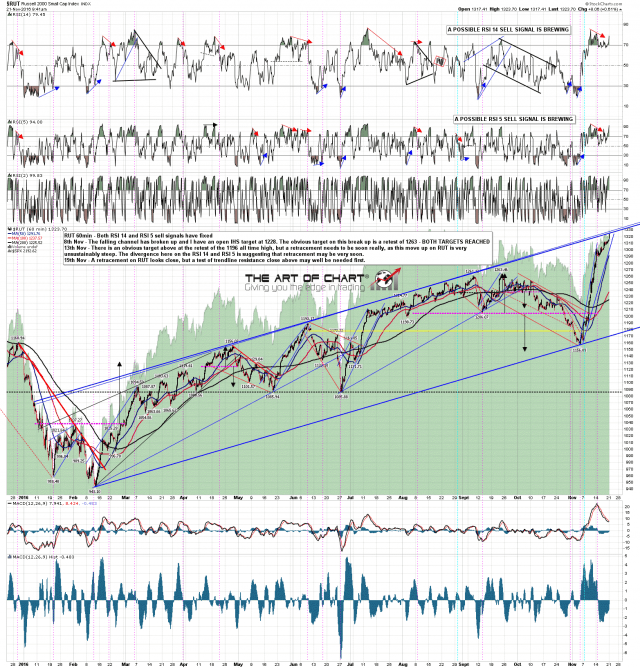
The SPX high this morning was 0.09 handles under the ATH, so I’m treating the bull flag target at that retest as made. That’s the good news for bulls and it may well be the high point of the week on SPX and RUT, though NDX is looking toppy here too, though less obviously testing serious resistance at the high this morning.
The 60min charts on all three are leaning towards seeing some well overdue retracement starting in this area, and if seen that may well dominate the rest of the week. There is also a possible RSI5 / NYMO sell signal brewing here on the SPX daily chart, which I’m watching with interest. SPX daily chart:
RUT has reached the resistance trendline I was looking for and that’s looking pretty solid so far. It wouldn’t take much to fix both RSI 14 & RSI 5 sell signals on this chart. RUT 60min chart:
On SPX the obvious retracement target and support zone would be in the 2140-60 range. There is a decent looking possible double top setup on SPX now of course, but I won’t be taking it particularly seriously unless SPX can punch back down through the daily middle band, currently in the 2145 area.


