A less common latin phrase today and this one means ‘holding a wolf by the ears’, and I think that’s a decent description of what we are looking at on equities here with the frankly amazing amount of compression on the daily bollinger bands. My friend Mike Vacchi has looked back ten years and this level of compression is unprecedented in that time and possibly a lot longer. The range between the daily lower and upper band on SPX is down to 26 handles, about 1.2%, so the journey between them is down to a level where Yellen clearing her throat might take SPX from one to the other. What does this mean? Well it may mean that we are building to a very strong move in a direction yet to be determined. A hard compression considerably smaller than this one delivered the mini-crash a year ago. This is the sort of phenomenon that advises caution.
The bears woke up for a while yesterday but failed to take out Friday’s low or sustain the trend down into the afternoon. They did however close well below both the 50 hour MA at 2177 and the daily middle band at 2179.5, so that was still a bearish close, and yesterday’s move could follow through today.
Normally on the first of the month I’d be leaning bullish, but there are some other factors to consider today. The first is that although the first trading day of September has leaned bullish historically, SPX closed down five of the last seven, so that hasn’t been the case in recent years. Stan’s low window extends through to the close on Monday, so that’s to the close tomorrow on SPX as Monday is Labor Day. ES not sustaining much trade over the weekly pivot at 2172/3 so far. I called an IHS target at 2176 yesterday afternoon on the subscriber twitter feed at theartofchart.net, and that target was made at the overnight high, but the rally failed there. We could see lower today.
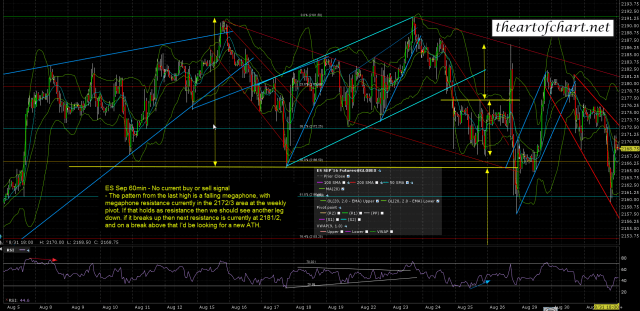
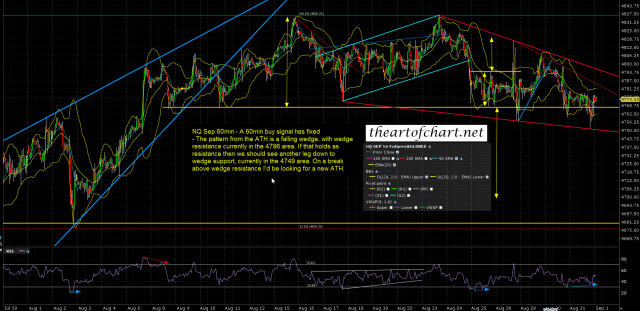
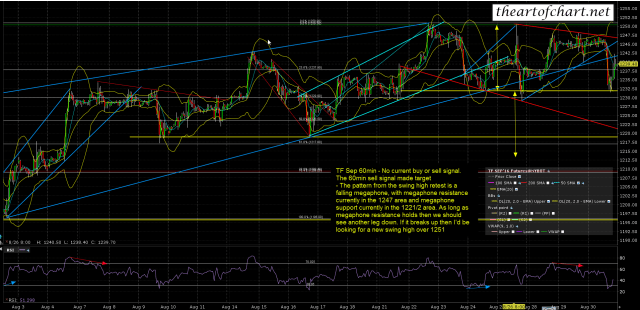
Resistance above is best expressed on the ES, NQ & TF bonus charts that I do for subscribers to the Daily Video Service at theartofchart.net, so I’m posting them again today with the notes on the overnight action that I added this morning. If we see these resistance levels break then we likely head to retest the ATHs on SPX and NDX. If we don’t then the bears might still impress us over what remains of this week.
ES has broken up from the falling megaphone and retraced 76.4% of it. If we are to see a decline today that may well be it, though there is a declining resistance trendline in the 80/1 area that is an alternate target if ES goes higher. Over 81 I’d be leaning towards a retest of the ATH. ES Sep 60min chart:
NQ has rallied back to test falling wedge resistance and that has held as resistance so far. The 60min buy signal has reached the possible near miss target. A reversal there targets wedge support in the 4749 area and if tested that might potentially break, as 30% of these wedges break down. 70% of them break up though and, if seen, the target on a break up would be a retest of the ATH. NQ Sep 60min chart:
TF has rallied most of the way back to declining resistance overnight, and as long as that holds, megaphone support, currently in the 1220 area, is a possible target. TF Sep 60min chart:
Stan and I are doing our monthly public Chart chat on Sunday looking at the usual wide range of about 40 instruments, and that should be very interesting. If you don’t believe that ignorance is bliss, then you can sign up for that here. 🙂


