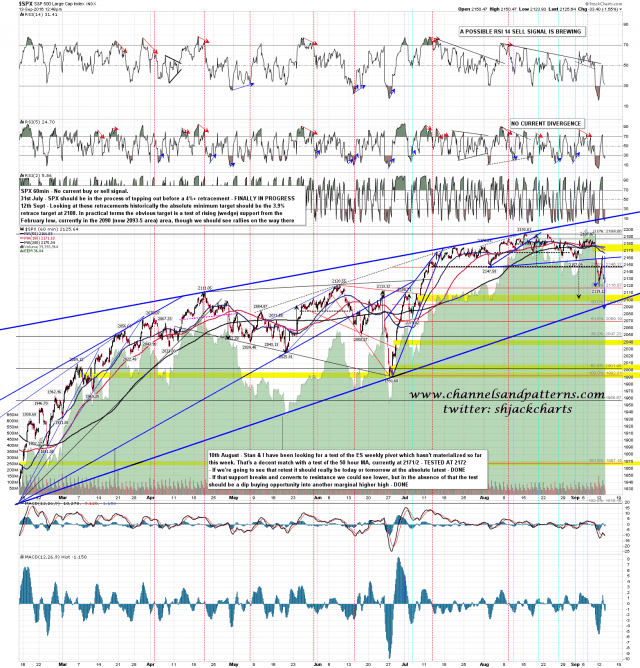
It’s been a bit of a bumpy ride since Friday morning, which I can say because I am a master of the understatement, and SPX broke back over my 2148 resistance yesterday, but failed just under the monthly pivot test into a retest of Monday morning’s low today. SPX should continue down to at least my weekly punch stat minimum target at 2108, and really further into rising wedge support, currently in the 2090-5 area. SPX 60min chart:
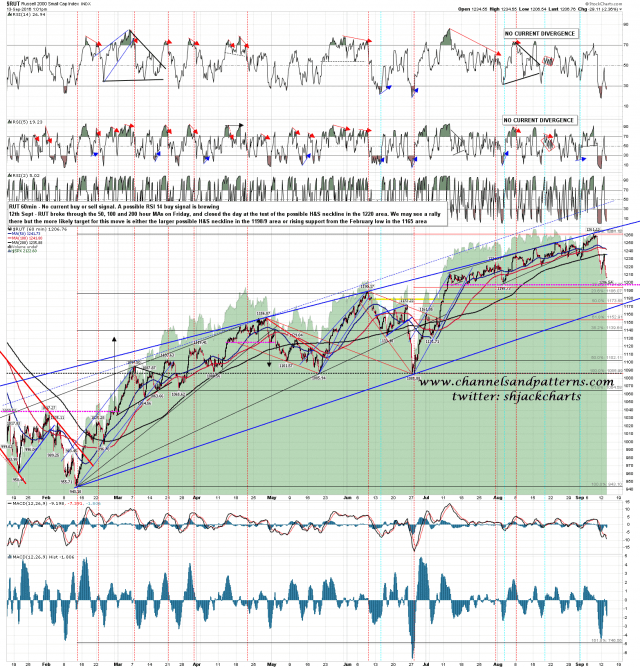
RUT has already broken yesterday’s low and is coming into the right area for a possible reversal though it too should go a bit lower. RUT 60min chart:
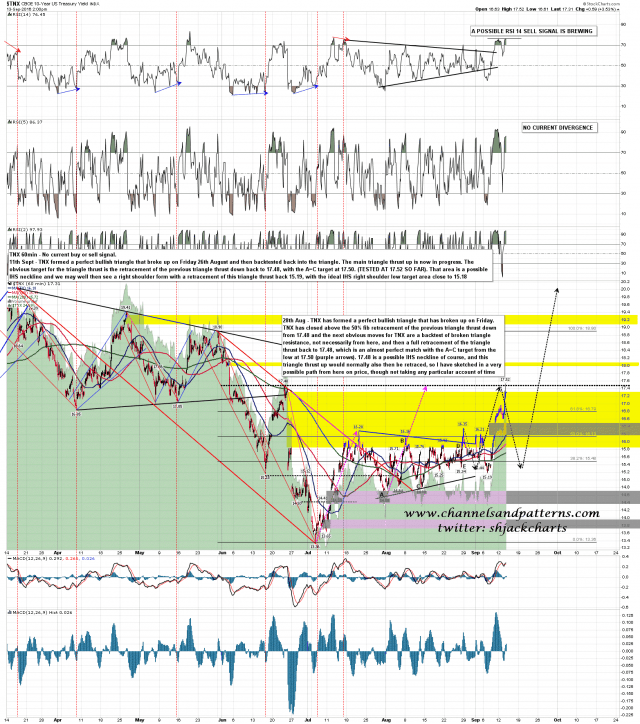
Bonds and SPX have been moving with a strong positive correlation the last few days and bonds have reached a possible short term reversal area here. I sketched in an ideal path on 10yr bond yields (TNX) on a chart from the Trader’s Chart Service at theartofchart.net on 28th August and (buffs fingernails modestly) TNX has followed it well since then. The ideal target for the current move and that has been reached today, with some rejection at 17.52. TNX should retrace the entire recent move back to 15.19, and that retracement may now have started. I’m not much on correlations and when I think bonds are going up I just tend to go long bonds, rather than think of shorting SPX. Nonetheless if bonds are bottoming out here then SPX might potentially turn here too.
I’ve already reversed long on ZB here. ES I’m still watching carefully. TNX 60min chart:
Stan and I did our free public webinar on AAPL, AMZN, FB, TSLA and NFLX yesterday and if you missed that then you can see the recording here.


