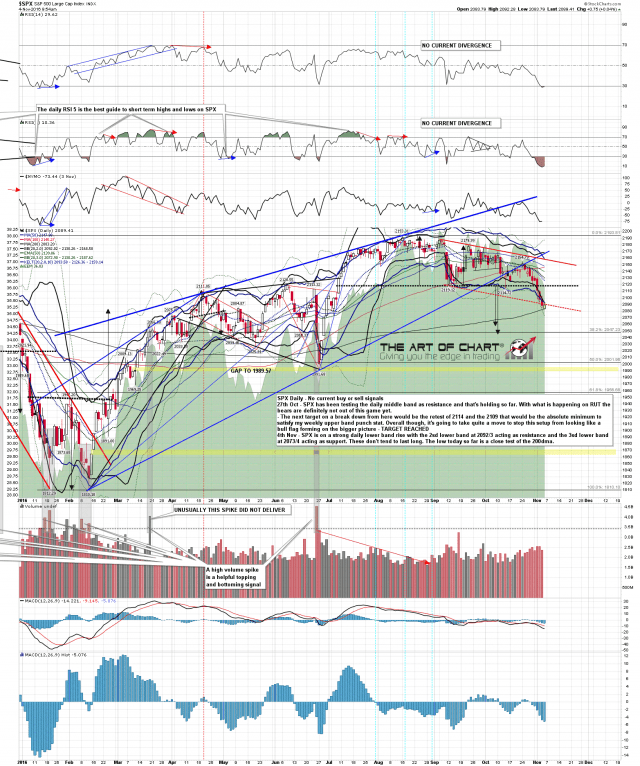
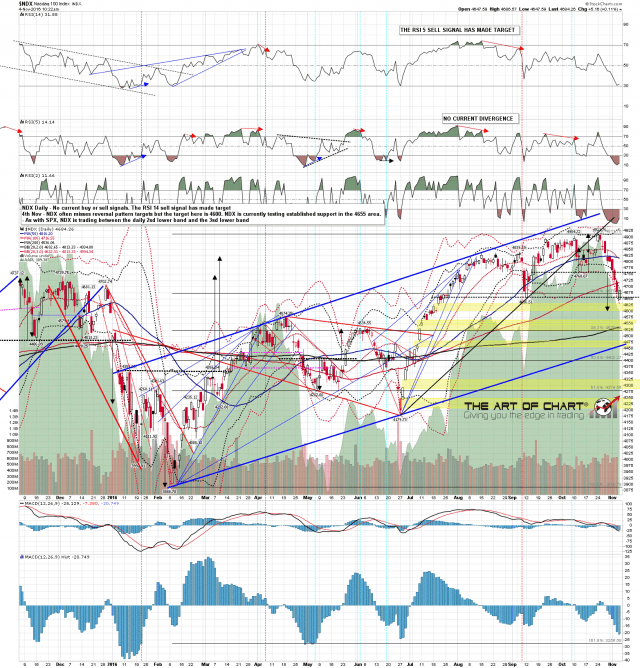
This has been a powerful lower band ride down on SPX, and both SPX and NDX have been trading between the 2sd and 3sd lower bands. These don’t tend to last long and usually end with powerful rallies. The low on SPX today was a test of the 200dma and that is an obvious possible launch area. SPX daily chart:
The most bearish looking of SPX, NDX and RUT is NDX, as there is an open double top target there at 4600. Testing decent support on the way in the 4655 area. NDX daily chart:
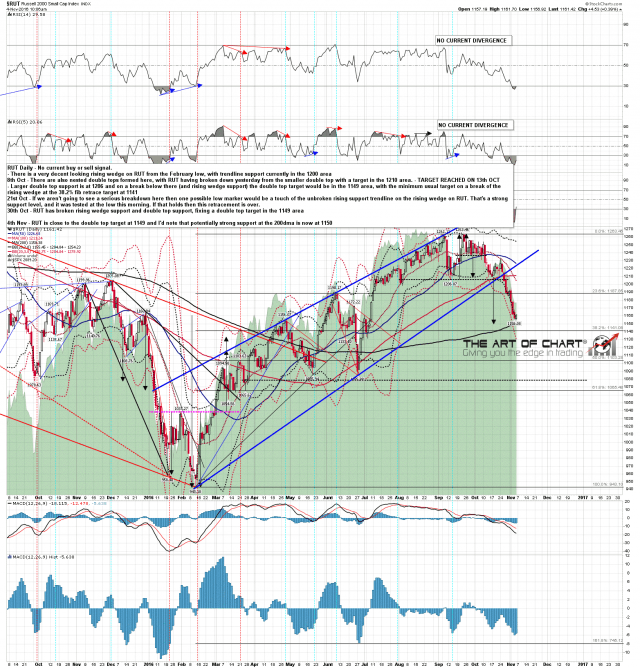
I posted this RUT chart on Tuesday and was saying that I’d expect this double top to make target at 1149. I’d note that the 200dma is currently at 1150. That is a very possible support area, and possible low for this move. The current low on RUT is at 1156 and it should make the full target, though that might be after a strong rally. We would usually see a strong rally before any meaningful low could be made, and we haven’t seen one yet. RUT daily chart:
Resistance on ES is clearly in the 2092/3 area (2098/9 SPX area) today. If bulls can convert that to support then we likely see a strong rally. If they can’t then I’ll be looking for that double top target on RUT.
Stan and I are doing our monthly public Chart chat on Sunday. This is free to all and if you’d like to attend you can register for that on this page here. Everyone have a great weekend. 🙂


