
Good morning, everyone. I am typing this post about 15 minutes after the release of the jobs report. I state that right out front since the markets tend to be especially volatile on days like this, please there are absolutely meaningless events – – such as the opening bell and the close of the European session – – which have outsized effects on the markets for reasons I simply cannot fathom. Having said, that, keep in mind these charts are merely a snapshot in time.
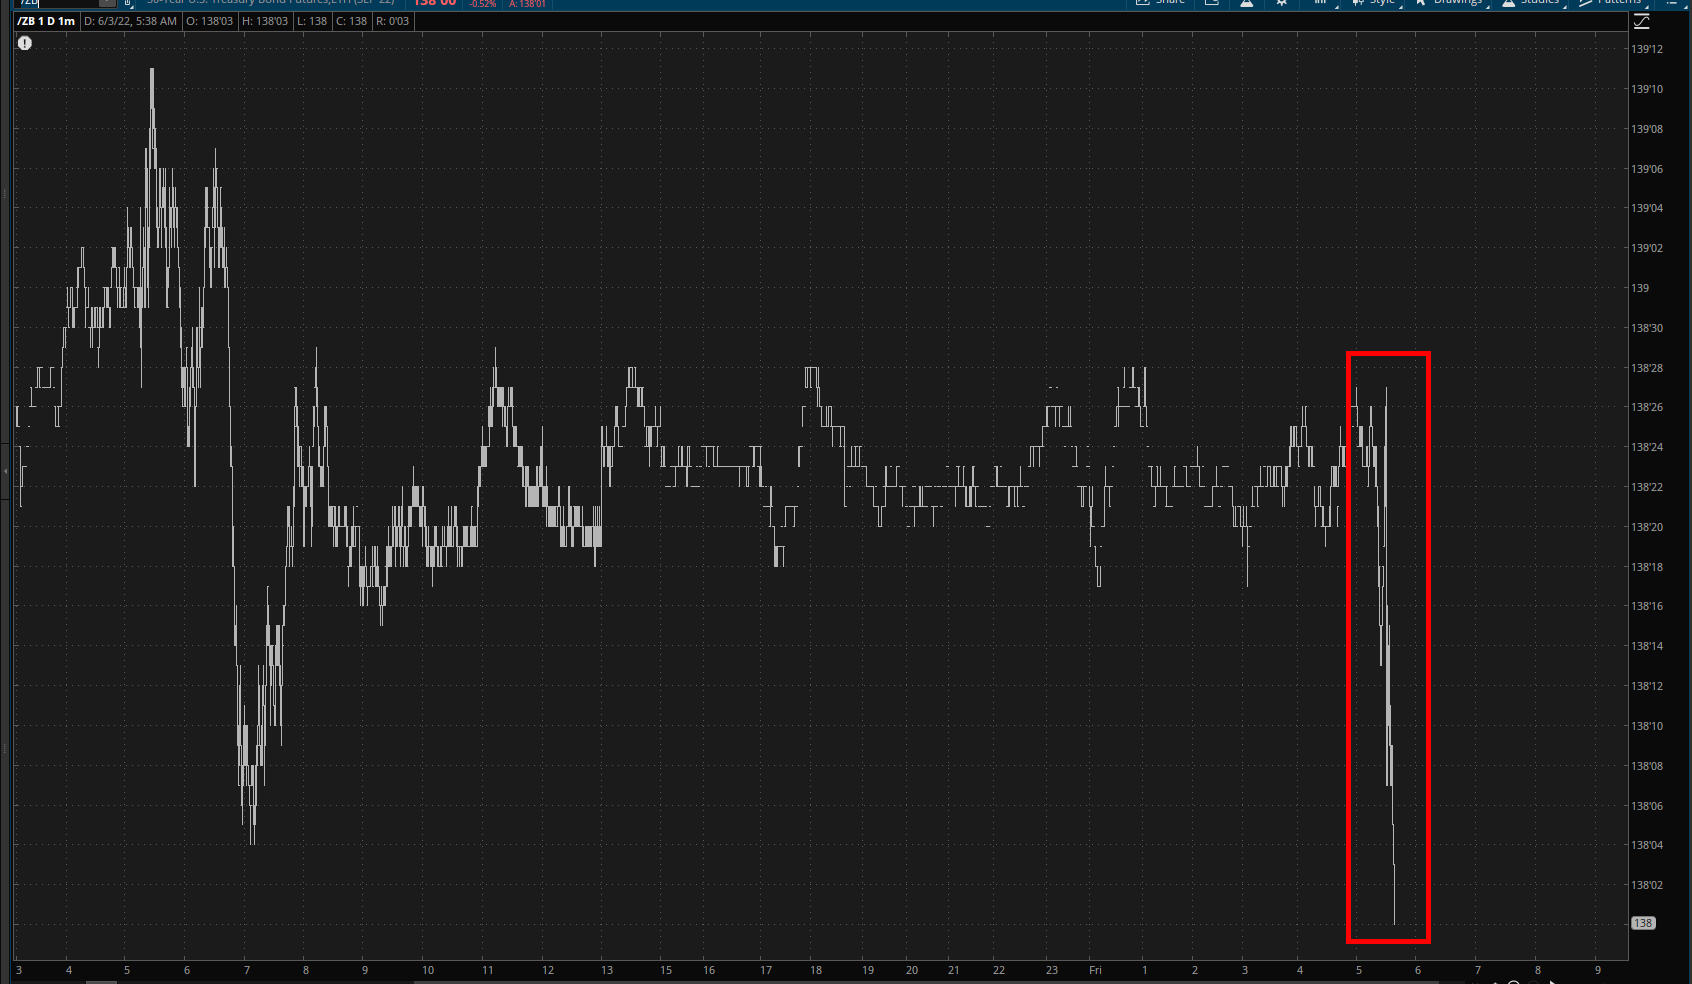
The immediate effect of the jobs report was that bonds took an instant tumble.
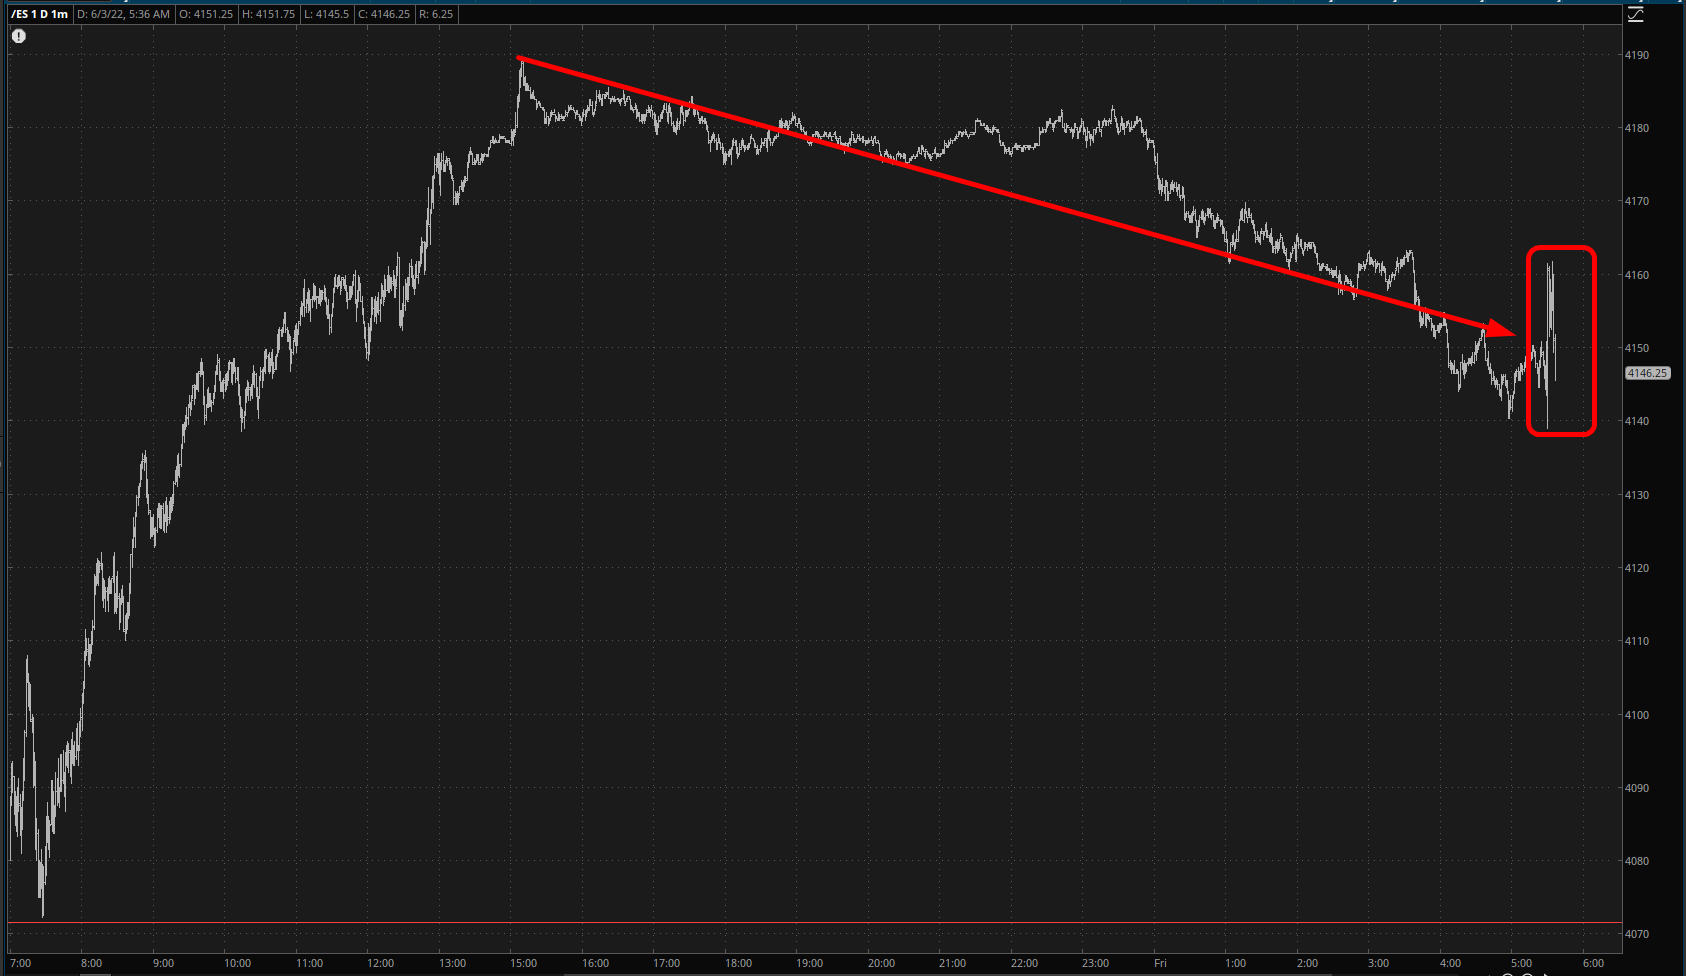
More germane to my interests, the equity futures had been on a gentle downslope all night long. When the jobs report came out (which, I suppose, was welcomed since the wages didn’t come in hot) there was a diminishment in the drop, but as I am typing these words, we’ve slipped back down to the lows.
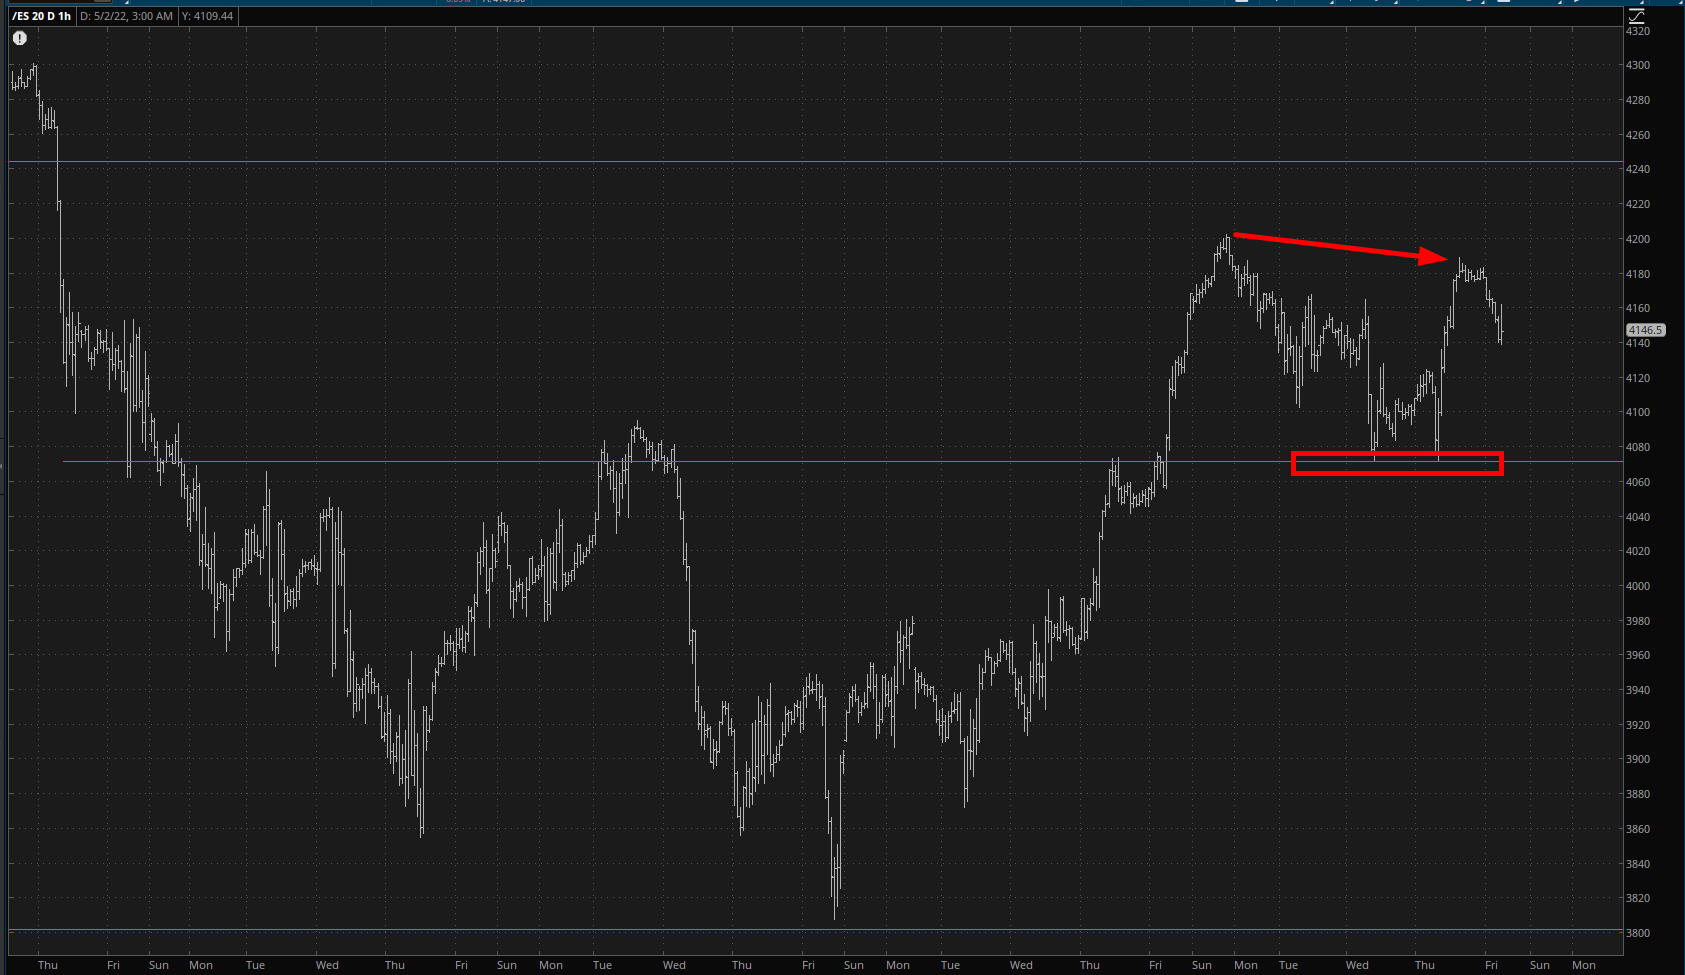
Here’s what we can say about the longer-term /ES chart below:
- The high yesterday was a lower high compared to the 4200+ achieved days ago;
- It is absolutely crucial for the bears that the price level 4071.50 fail
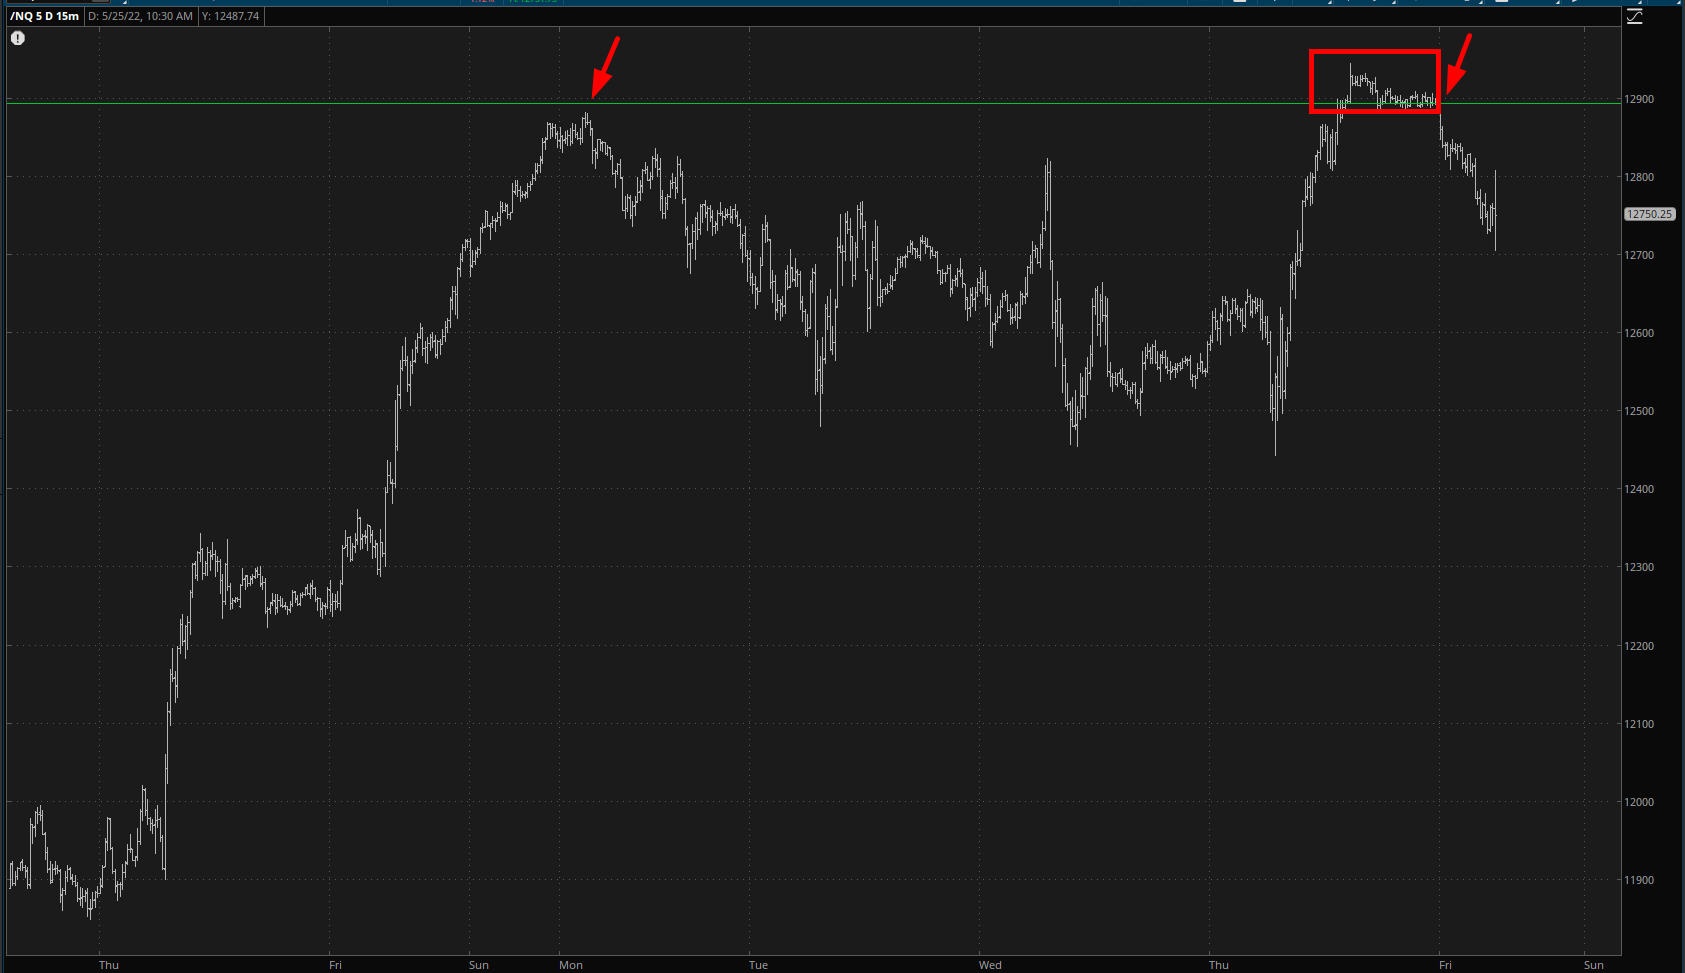
As for the NQ, it challenged, and briefly exceeded, its major Fibonacci resistance (unlike last time, when it did a perfect kiss-and-good-bye) but, mercifully, has flipped beneath it again.
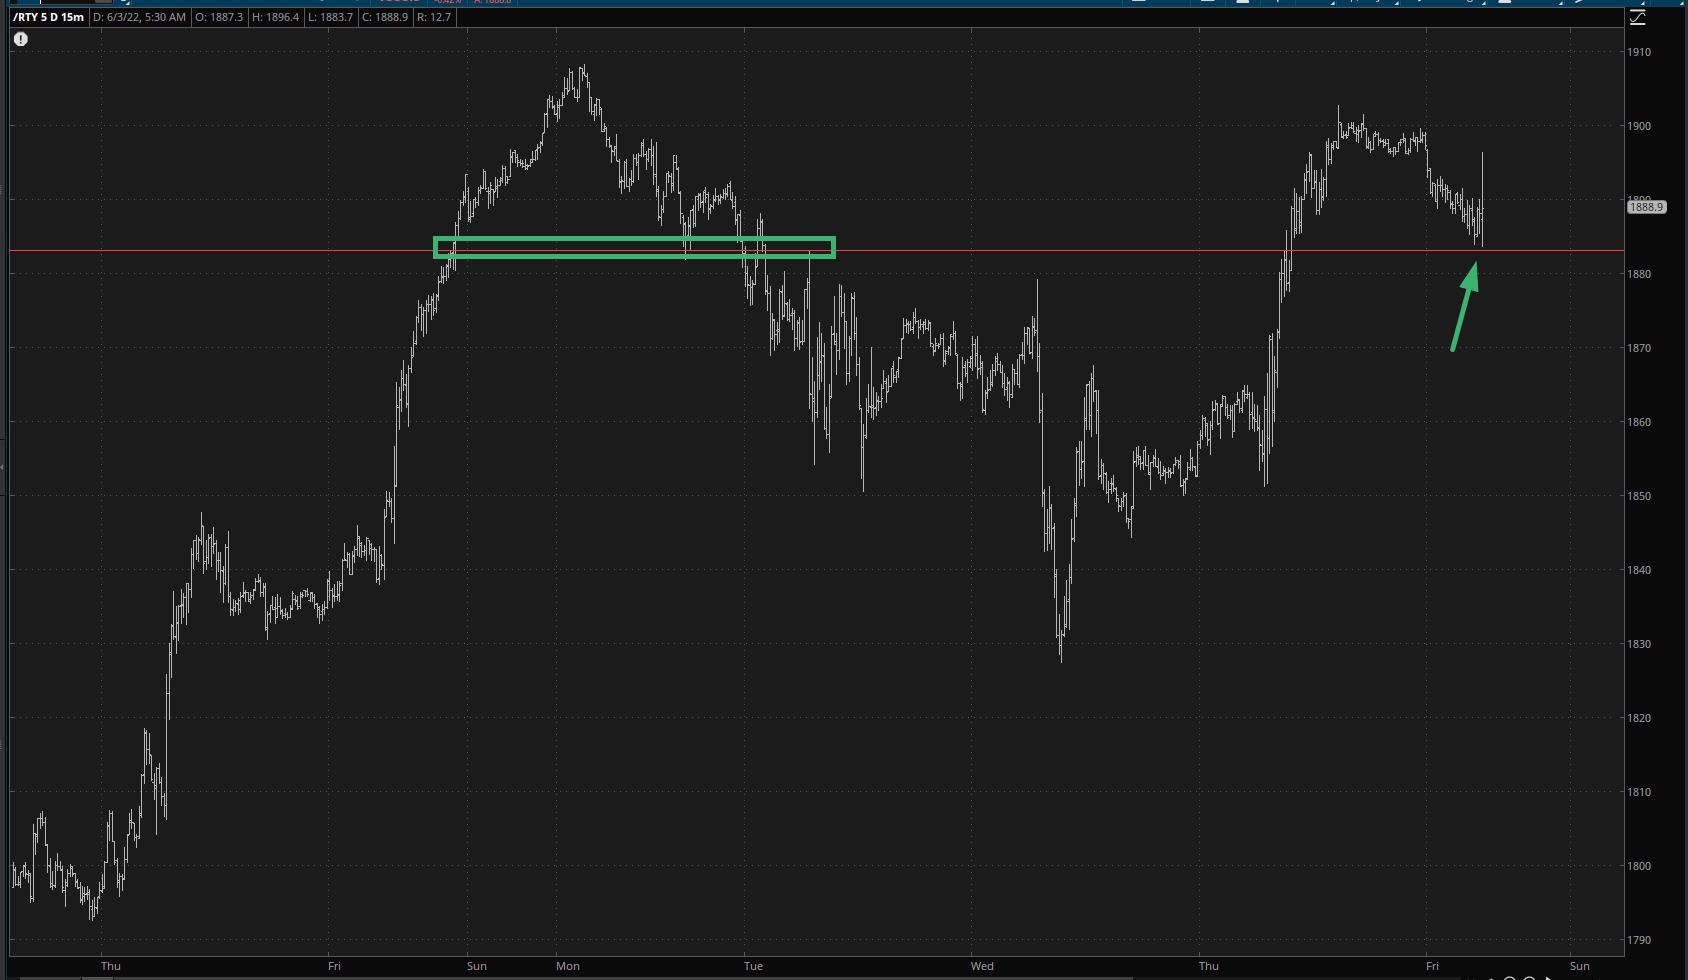
As for the /RTY, it is the only one on the bullish side of the Fibonacci. That level is 1883 and it, too, must be broken.
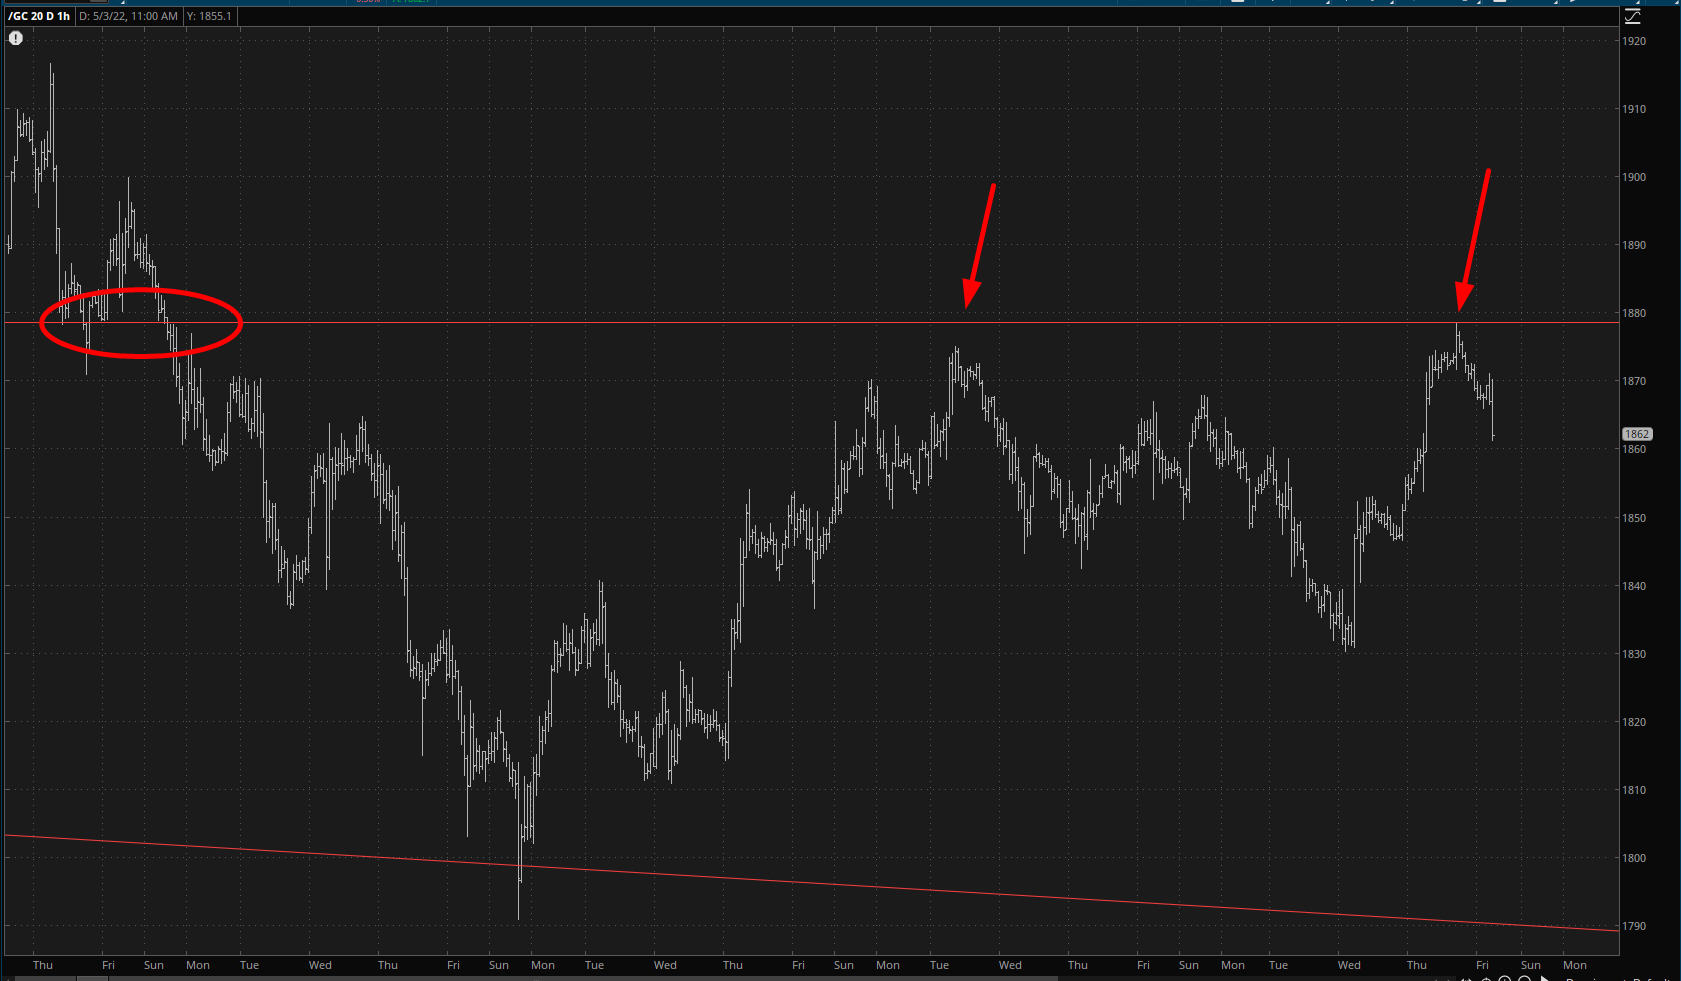
One non-equity remark – – I was intrigued to see how gold has its own bearish relationship with a horizontal (to be clear, this is a simple line, and has nothing at all to do with the Fibonaccis, as was illustrated above).
I’d like to thank the market gods to giving us all-red indexes right now because, quite frankly, I couldn’t stomach another green open. Seriously.
