
Let me start off by saying something crystal clear: not flipping from totally bearish to totally bullish on May 20th was the biggest mistake of the past twelve months (probably twenty-four months). I mean, it was right there in front of me: these Fibonacci retracements are not new information. They’re well established. But I got greedy and I decided to wait for more profits, and then BLAMMO, here we are. It’s a damned shame.

So now we’re back to the waiting game. And the question game. Is the bounce over? Will it EVER be over? Are the lows in for the year? Will I ever have an IQ over 20? Inquiring minds want to know.
If there is one takeaway from that entire fiasco, it’s a vitally important trading lesson. I want you to tattoo this on all four of my limbs so I never miss it:
If it feels incredibly good, get out immediately.
That seems obliquely sexual, but c’mon. This is a charting site for traders. It’s a life lesson.
But what’s done is done. The obscene profits from such a short time ago have become vastly less obscene, and at this point I feel as miserable and un-confident as I felt exuberant and super-confident back on May 20th. Perhaps that is a sign unto itself.
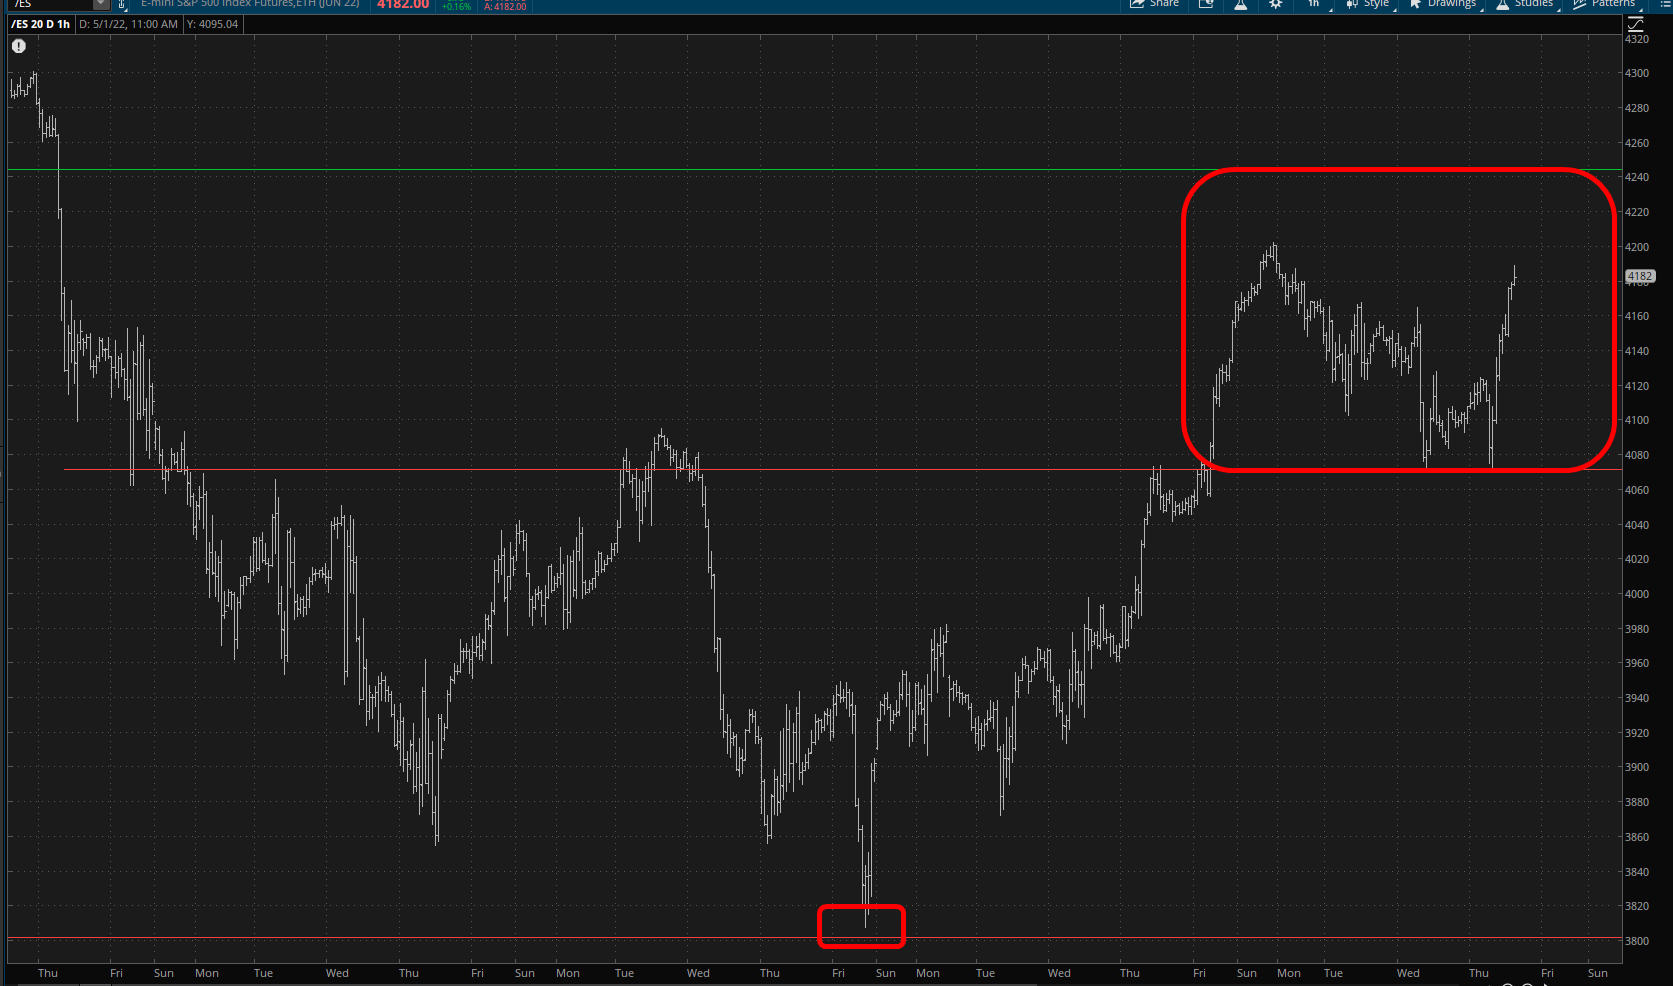
But let us return to the Fibonacci levels. Below is the /ES. At the bottom, in the center, I’ve marked the oh-my-God-so-obvious support point. Please take careful note that the horizontal line in the middle is NOT a Fibonacci. It is simply anchored to the low price in recent days, and it is roughly at the 4100 level. Again, it has zero meaning with respect to the Fibonacci levels.
The horizontal line near the top is, however, a major Fibonacci and its value is roughly 4244. We’ve managed to get above 4200, and who knows, maybe the market will interpret Friday morning’s jobs report in a bullish way and send it the 4244 or above. At this point, we need to fail that ~4100 level to get the bears back in the game again. As it is now, the bulls absolutely have grabbed onto the steering wheel ever since May 20th.
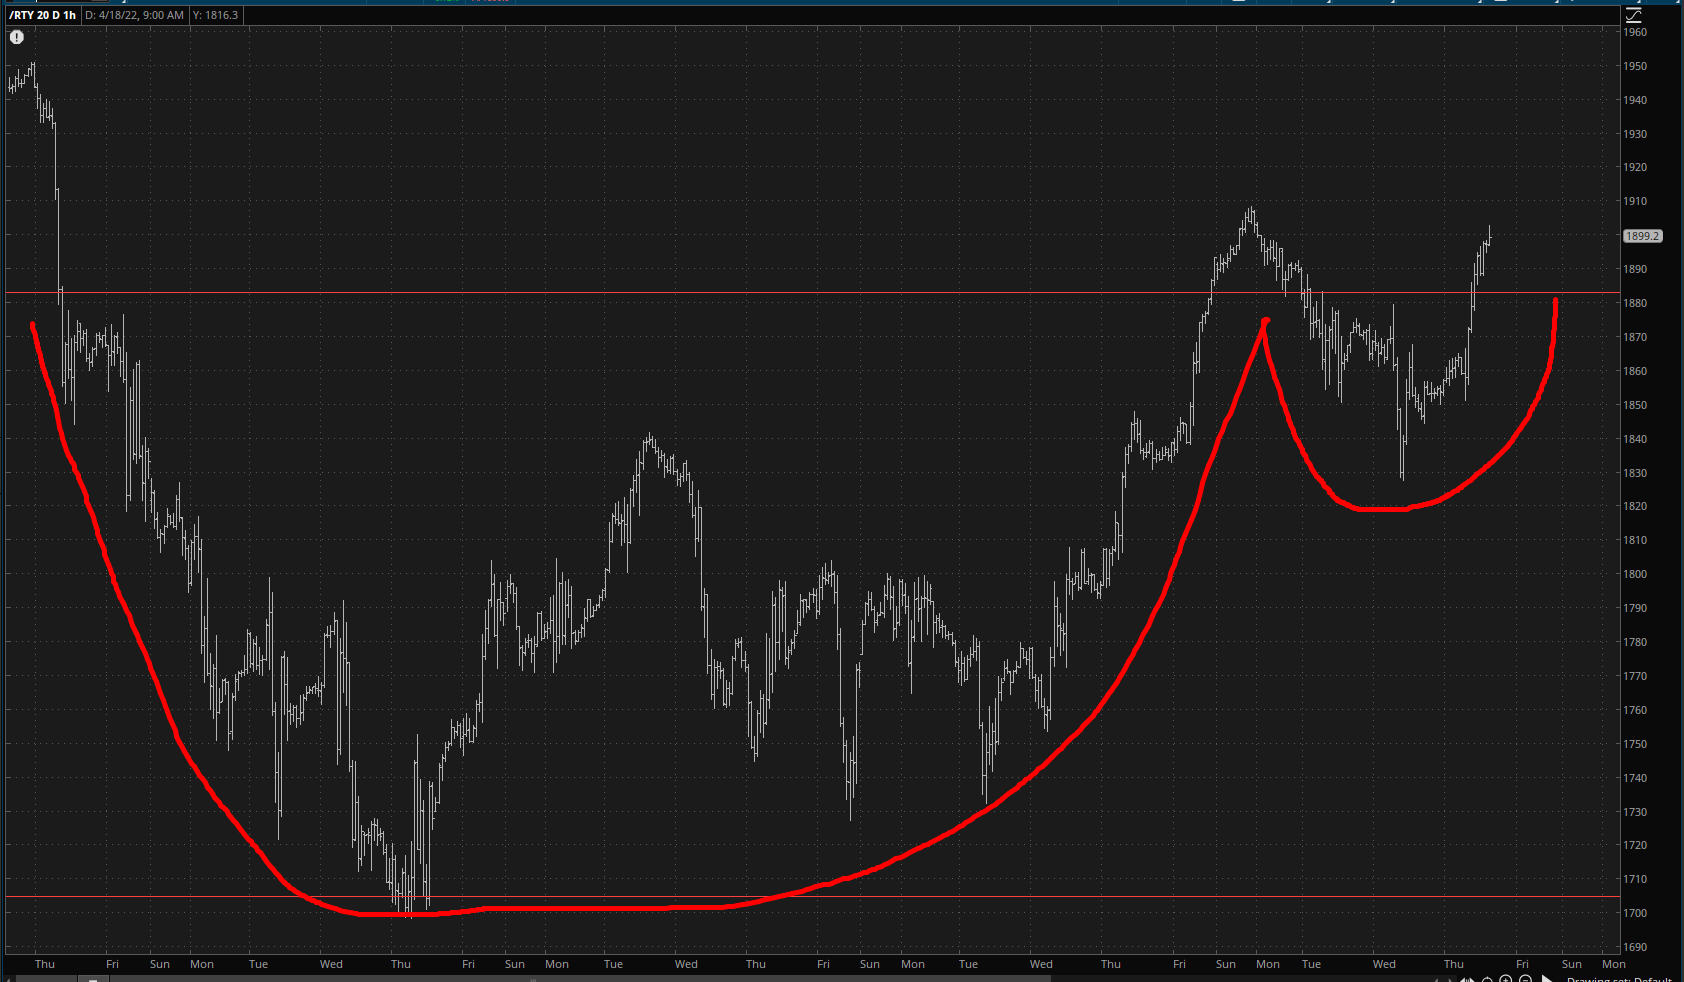
In fact, we could take it a step further on the Russell 2000 futures (/RTY) and show how this is in a bullish cup-with-handle pattern (forgive my clumsy drawing and unsteady hand).
I do want to drive home an important point about these retracements. Just because we go a little below them doesn’t mean it’s all-systems-go and we’re going to collapse to the lower one. Likewise, just because we go a little above one doesn’t mean the bears are totally screwed and it’s the start of a new decade-long bull market. My foolishness was getting excited about the “failure” of the retracement levels a couple of weeks ago and thinking it meant something. It was the wrong context for it to mean something, because the market has been selling off for seven solid weeks, which hadn’t happened in a freakin’ century.
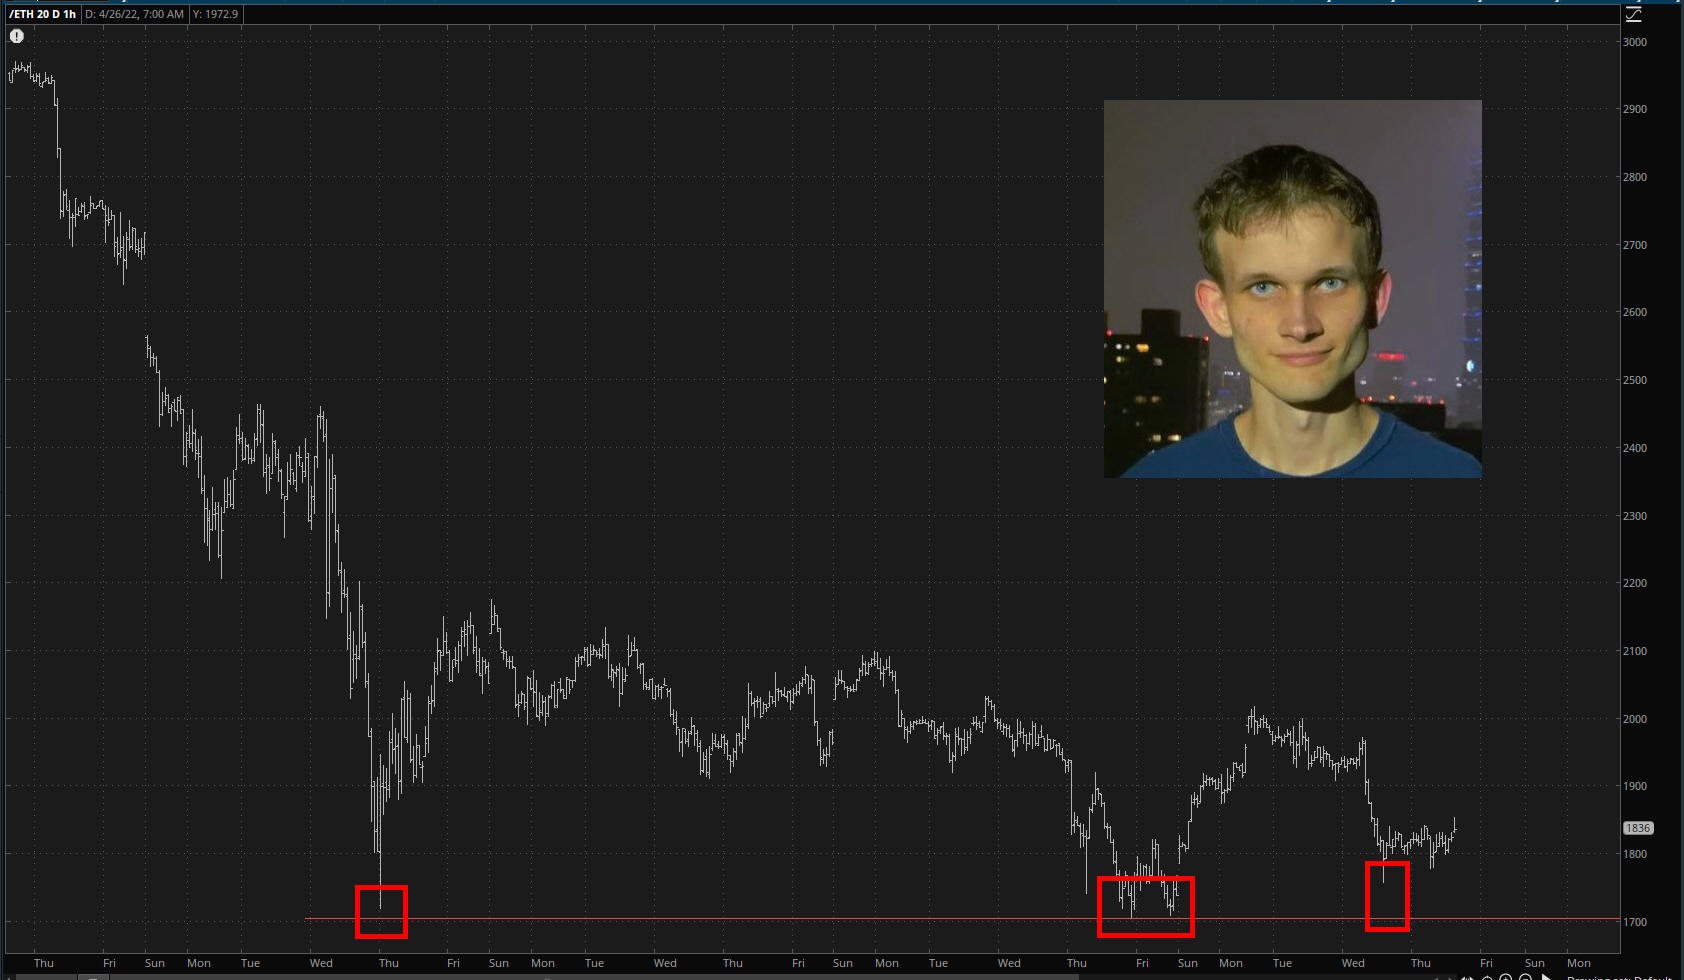
And I know I keep mentioning Ethereum, which seems to have nothing to do with anything, but honestly, this 1700 level is being defended like mad. I believe that should 1700 fail, it’ll be an important psychological spark that will flow to equities.
Anyway, for me, it’s been pretty miserable the past two weeks, and it’s extraordinarily discouraging. I’m sure some of you can relate that when you’ve got a nice fat profit, it feels like you’ve truly “earned” it, but when it vanishes, it feels like something has been taken away. Well, I guess what one “earns” must be cashed out at some point, particularly with leveraged instruments like options, since there’s no accrual taking place otherwise.
Consider this a low water mark in my spirits and use that as a guide for your own market judgment.
