I’m making an adjustment to my posts from now on where instead of simply speculating about future market direction, I’m going to offer a trade idea and plan. (insert customary disclaimer, educational purposes only, blah blah, I can’t make you buy or sell, use the plan at your own risk, etc. etc.) So let’s get to it.
The Context: As some of us are painfully aware, the S&P500 has been making higher lows and lower highs since the low of September 12th resulting in a triangle-like pattern.
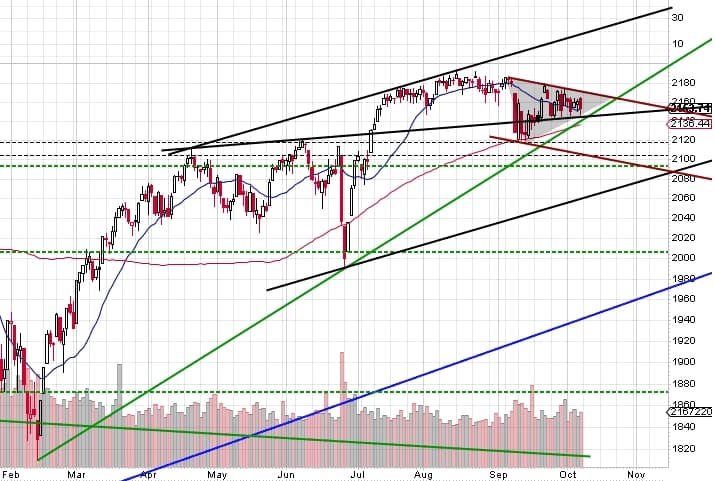
It would seem at first glance to still be a triangle except that the bottom line has been adjusted a few times this past week. Zooming in to the hourly, I’ll propose a different way of looking at it.
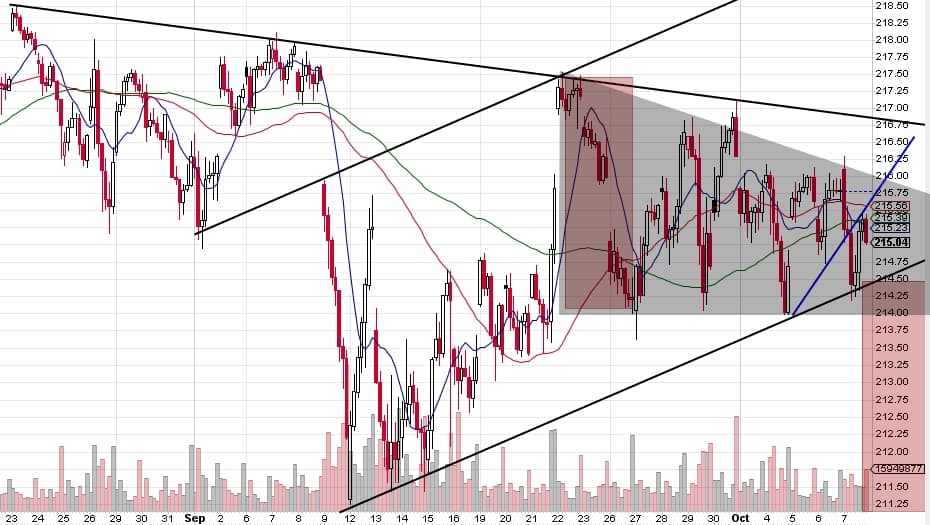
After the initial price breakdown on September 9th, price retested the underside of an established daily channel (starting Sept 1st above, but actually anchoring further back). Since that point, price has formed a descending triangle which is just a fancy way of saying support keeps getting hit and the highs keep getting lower indicating selling pressure. Additionally, breadth is giving some clues.
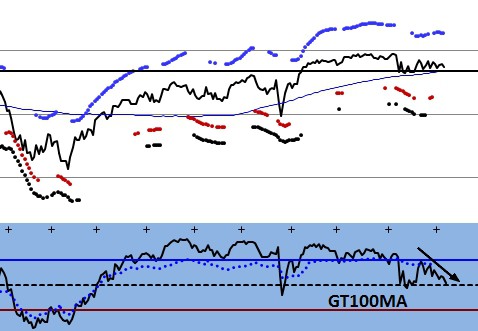
Even though price seems relatively flat on the SPY chart above, one breadth reading I follow is the % of stocks above their 100 day moving averages. That reading has been dropping ever since Sept 22nd (channel underside test day). Given this backdrop, a VIX making higher lows, and the generally lethargy in price since the mid-summer, I am expecting some selling to take place soon. That is my hypothesis which can be accurate or wrong or something in between. Now what?
The Plan: Since price is basically right in the middle of all the congestion, I want a clean entry that minimizes my risk. I need to know quickly if my hypothesis is incorrect. So here is how I’m going to handle it.
The Entry/Stop: The most solid and best-tested line is the upper downtrend line. Since Monday is Columbus Day and usually has lower volumes, I would not be surprised to see another melt up into resistance. If, however price breaks down right away, these important levels get retested and the kiss goodbye is my favorite and most clean entry because initial breakdowns often reverse quickly and retest whatever support/resistance was just broken before continuing. These lines will also be my stops. Any daily close above either and the trade is DONE, no arguments. It took me a long time to learn to let the market come to me. I no longer chase. I take trades on my terms only. I get the entry I want where I can minimize my risk or I let the trade go. I’ve learned that it’s better to take a few well-timed, well-positioned entries, than 100 half-assed entries motivated primarily by FOMO (fear of missing out).
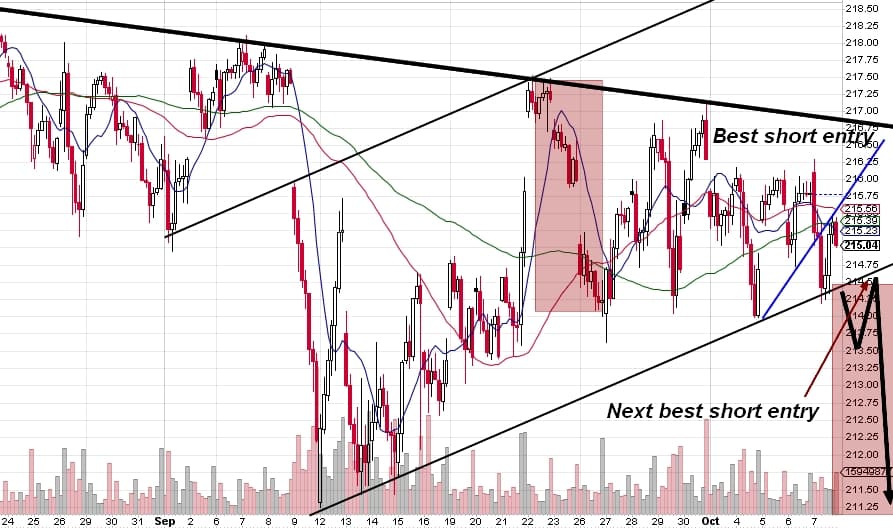
The Profit: Working strictly from the triangle measured move as an initial target, I’m planning to take profits at or below $211. The established channel’s low is at $210 so anywhere between $210 and $211 would be a good profit target in the short-term.
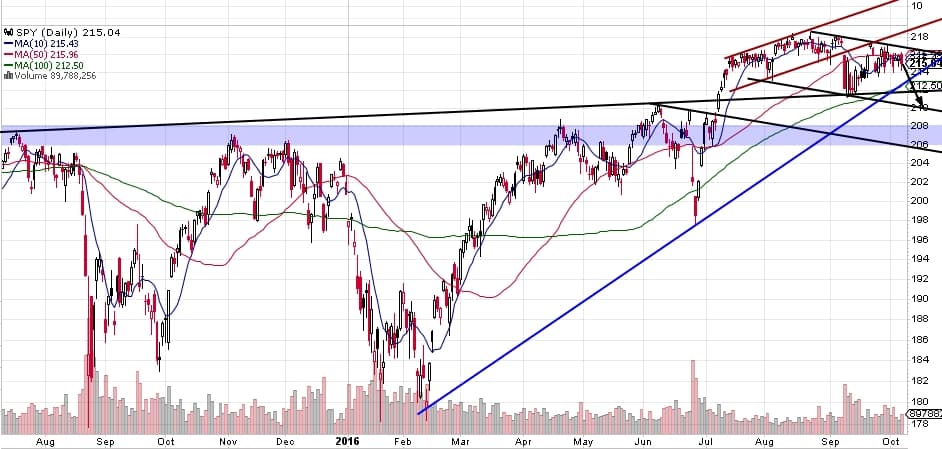
Zooming out to a year, my intuition tells me that a test of the $206-208 area would be a good support test for the S&P500, but I’ll need to see how this first bit unfolds before considering that possibility.
So with this plan, I am risking approximately .50c to make $6 from the upper entry or $4 from the lower entry.
Good luck this week, Slopers!

