Slope of Hope Blog Posts

Slope initially began as a blog, so this is where most of the website’s content resides. Here we have tens of thousands of posts dating back over a decade. These are listed in reverse chronological order. Click on any category icon below to see posts tagged with that particular subject, or click on a word in the category cloud on the right side of the screen for more specific choices.

Simplifying the Complex Metals Complex

By -

by Avi Gilburt, ElliottWaveTrader.net

First published Sat Oct 15 for members of ElliottWaveTrader.net: We have many analysts and commenters posting many different perspectives on the metals for years. Some view them as a terrible investment and others view it as the only reasonable investment. I am not going to discuss the merits or fallacies contained in both of their perspectives, but I would like to simplify the potential in the complex for the average investor.

You see, this complex is not that complex at all. Sentiment is what controls this market, and when sentiment reaches an extreme, the market shifts in the opposite direction. That is what we are patiently awaiting at this time.

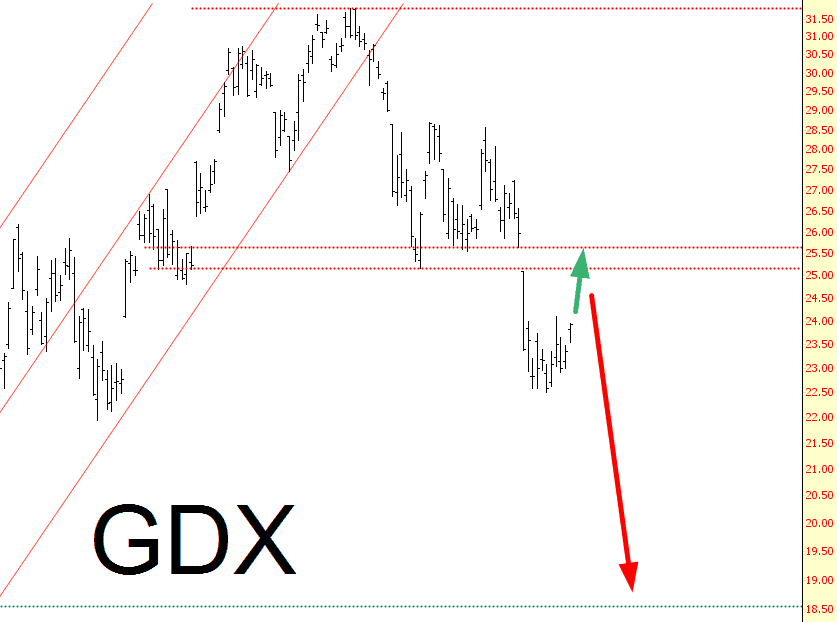
Currently, our wave structure suggests that we can see one more lower low to complete a 5th wave in a c-wave of this wave ii pullback. While I certainly can be wrong in this assessment, this is my higher probability wave count at this time. And, as long as we remain over support, I will maintain this count and expectation.

(more…)

The Path to 2016

By -

I have very little else to say about the market (and I’m about to prove it!) I’ll just close out the day by remarking that the intraday ES, shown below, calls for a drop to 2016 before the year is out (which would be kind of fitting, since that’s obviously also the number of the year itself). The break-and-retrace is picture perfect, but we must slice below 2100 to really get our game on.

1017-es

Testing Resistance Too Often

By -

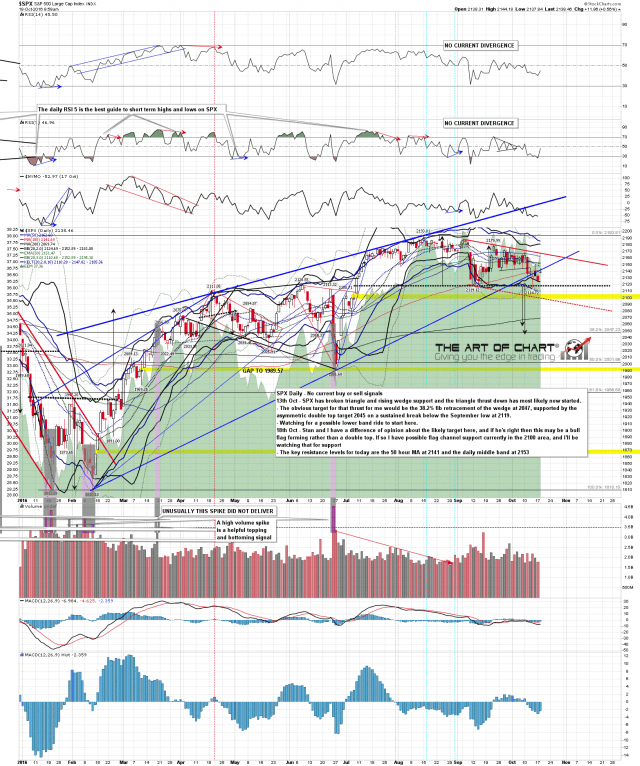
I posted my daily premarket video for subscribers to the Daily Video Service at the artofchart.net on twitter this morning, because there was a serious chance of a bull breakout on the opening setup. That’s fading a bit now, with SPX failing at the retest of the 50 hour MA at 2141, but it’s still possible, and on a break above then main (closing) resistance is at the daily middle band in the 2153 area. You can see that premarket video here. SPX daily chart:

161018 SPX Daily

(more…)