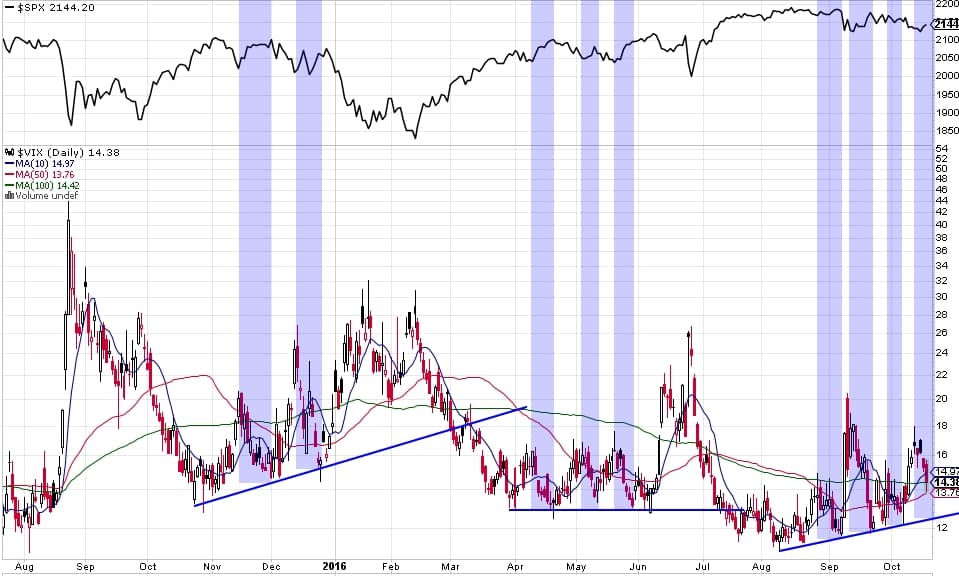
I don’t have a trade for you all in this post, but I just wanted to quickly share the VIX and its tendencies for forecasting the S&P500’s potential. First, I want to point out the uptrend line in the VIX right now. I’ve highlighted the times when VIX has returned to those trendlines in the past year. At most, price has returned to the highs during such declines, but once the VIX trendline is hit, caution is very warranted, especially since sometimes, that touch then launches actual sustained selling periods.
I made a minor mistake on the chart below. You should note to ignore the first decline in each cluster because that was the decline that established the trendline before which none existed. Before these trendlines were broken, there was always a meaningful spike in the VIX first. This doesn’t always happen, but once it does, upside is the path of least resistance.

(more…)


