Slope of Hope Blog Posts

Slope initially began as a blog, so this is where most of the website’s content resides. Here we have tens of thousands of posts dating back over a decade. These are listed in reverse chronological order. Click on any category icon below to see posts tagged with that particular subject, or click on a word in the category cloud on the right side of the screen for more specific choices.

Break Point

By -

Hello from seven miles above Colorado, as I am winging my way to MoTown. Instead of my usual griping and moaning, I’ll take on a hopeful tone about next week and say that we bears could finally get our day in the sun.

Chart after chart all shows the same thing: there is a trendline in place since February 11 of this year which is right at the cusp of failing. (In a few cases, like the Dow 30, it has already failed). What I’m watching most closely is the ES. A drop beneath the level I’ve highlighted below (about 2132) would do the trick.

1007-es

I’m positioned with 57 different shorts. I still think President Pantsuit is going to win, but I’ll be watching the ES on Sunday night while the debate is going on to see if Trump can produce a performance that isn’t absolutely horrible like his first time out.

Crude Trend Change?

By -

I’m having a good day (for the moment; I’ve learned not to trust these markets), and I’m particularly intrigued by the crude oil chart since I have a number of energy short positions. I’ve noticed that crude has been a relatively reliable trending market. It actually can sustain an uptrend or downtrend for a solid month or so (which is incredible these days). At the risk of oversimplifying things, here’s what I see:

1007-crude

Closing Window

By -

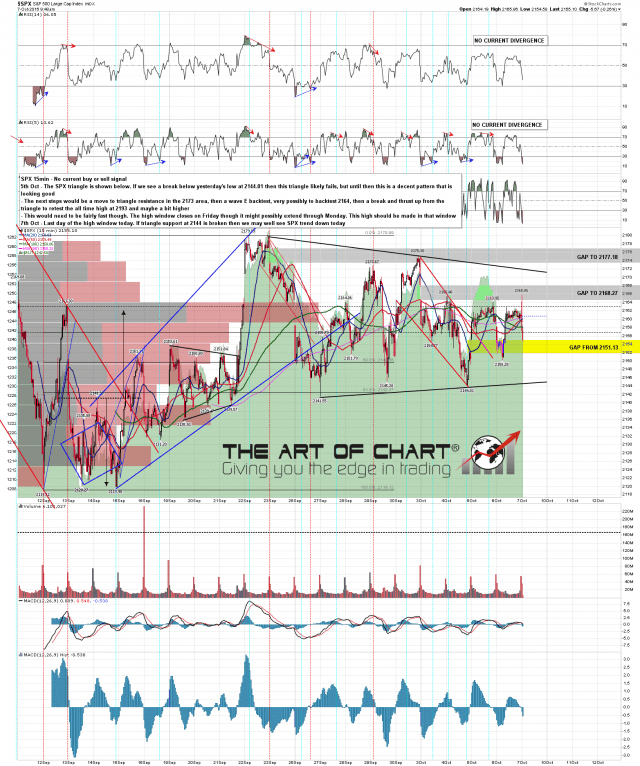
Today is the last day of the high window on SPX, and bulls have missed a couple of decent opportunities to break this up. With ES trading at 2151, the weekly pivot at 2154 was clearly never converted to support. If we are going to see a break up from this triangle then today is the last likely day to see that, and it’s not looking that promising at the time of writing.

Support levels to watch today on SPX are the 50 hour MA at 1259/60, the daily middle band at 2153, and triangle support at 2144/5. If we see a break down through 2144 then the chances are that break will follow through to the downside, and our expectation is that the downtrend that may already have started will likely dominate the remainder of October. SPX 15min chart:

161007 SPX 15min Triangle Setup

(more…)

London Crank-Calling

By -

The latest data from Obama’s limp, flaccid, faux-recovery just tumbled off the presses, and unemployment is back to 5% (which, let’s face it, is a miracle, since the Labor Participation Rate is 62.9%), so the BLS might as well just say unemployment is 0% and be done with the charade. Tens of millions of people are out of work and will remain so.

The market doesn’t know what to do with this data. In the few minutes I’ve been standing here watching, the ES and NQ have whipped from red to green several times. ZeroHedge has a series of graphics showing that, month after month, the market closes up green whether the numbers are a “miss” or a “beat”, so maybe this is just an algo-circle jerk until the day’s steady gains kick in. Hope springs eternal in the bearish breast, so obviously I’m hoping the obviously weakening economic data could actually create a few red numbers today.

(more…)